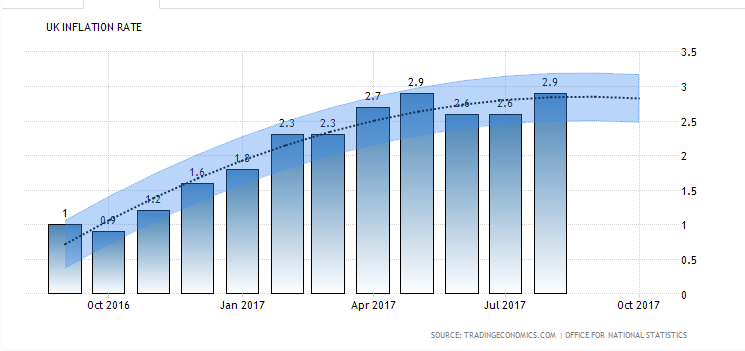
In the aftermath of Brexit vote, Bank of England (BOE) had cut the cost of borrowing to a new record low of 0.25% in order to support the economy. At the same time, Pound slumped against other major currencies due to the economic uncertainty. Sterling is currently worth 14% less against the Euro and 10% less against the US dollar than before the vote. However, due to the UK’s reliance on imports, the weak Pound increased the cost of importing food, fuel, and raw materials. As a result, living standards are increasingly squeezed and the UK now has the highest inflation rate among the G7 nations. In August, the UK inflation hit 2.9%, which was up from 2.6% in July. This number is almost 1% higher than the official 2% target. Below is the graph of UK inflation rate.
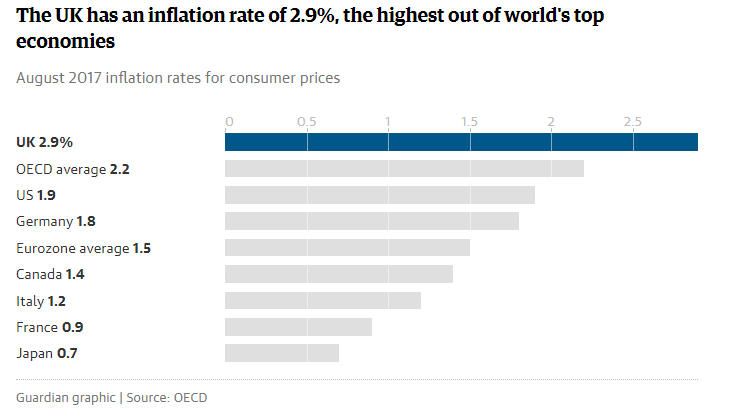
Among G7 countries, UK has the highest inflation rate. The rise in prices is also above the average of the Euro area and the G20 nations. Below is the comparison of UK inflation rate with other G7 countries and Eurozone average.
BOE signalling rise in rate in the “coming months”
The nine member MPC (Monetary Policy Committee) voted by a margin of 7-2 to keep rates on hold last month. However, they also made it clear that unless there’s a major deterioration in the economy, it would raise rate in the coming months. In the interview with BBC’s Radio 4 Today Programme below, Mark Carney, the Bank of England Governor, says interest rates will rise in the relatively near term.
BOE will meet two more times this year on November 2 and December 14. Expectations are high that the Bank will raise the benchmark rate in the coming November meeting. However, several prominent organizations and forecasting group, such as British Chambers of Commerce, ratings agency Standard & Poors, and EY Item Club have suggested the economic growth was not strong enough to warrant a rate hike. BOE’s rate decision could be based on the result of UK’s latest inflation figure for September which will be released tomorrow (Tuesday Oct 17). Economists predict that the CPI will have risen to 3% in September, the highest level since 2012. If the number comes out at the high end, the Central Bank may have no choice other than raising the rate.
Pound Technical Charts
Technical charts on two Pound pairs below suggest that we may see support for Pound.
EUR/GBP 4 Hour Elliott Wave Chart
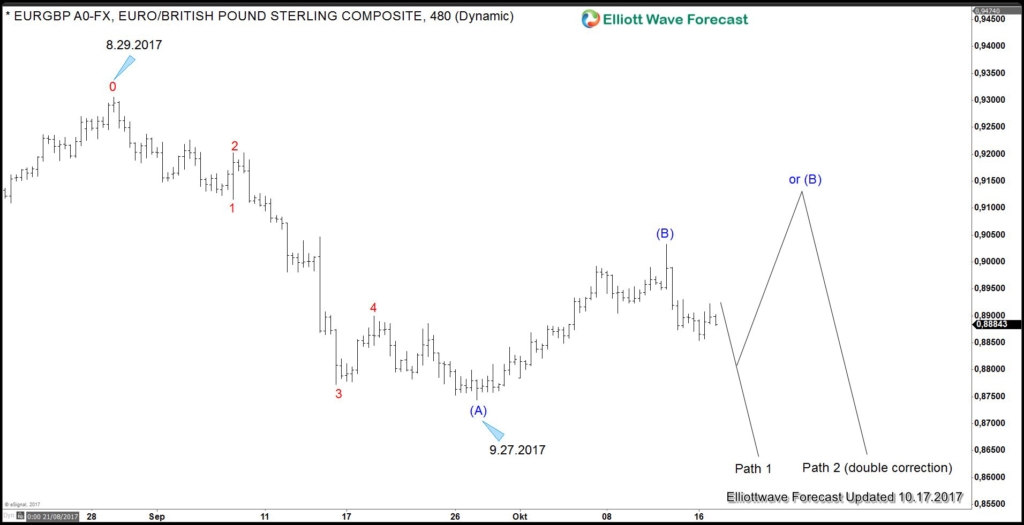
EUR/GBP looks to be declining in 5 waves from 8.29.2017 peak to 9.27.2017 low. If this is the right interpretation, then we could be looking for another 5 waves down which should be supportive of Pound. Wave (B) can either be done (Path 1) in which case the pair should then resume to new low below wave (A). Alternatively, it can do a double correction in wave (B) and see another leg higher before the decline resumes. Either way, another leg lower is expected once wave (B) is complete
GBP/JPY Daily Chart
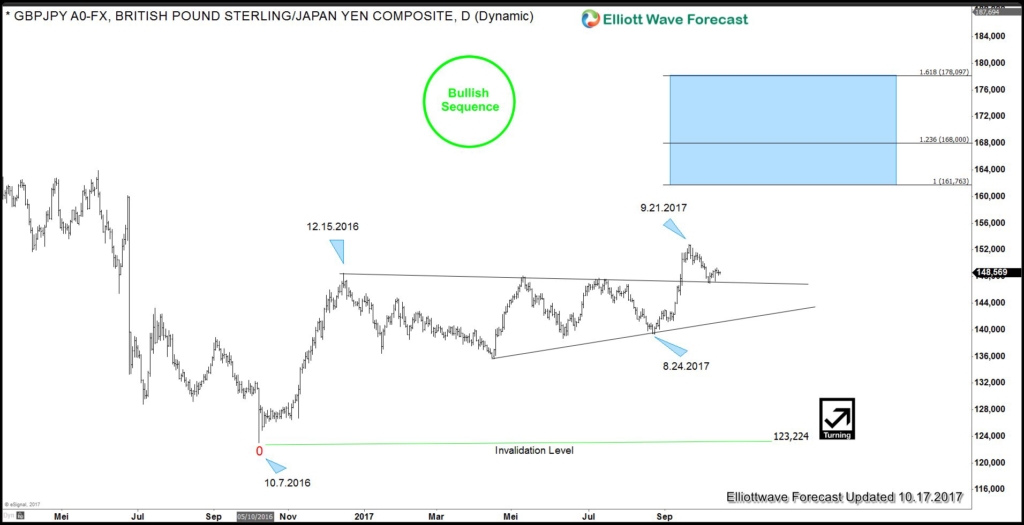
GBP/JPY Daily Chart above shows a bullish sequence from 10.7.2016 low as it creates a higher high sequence and the recent peak at 9.21.2017 broke above the previous high on 12.15.2016 high. The rally from 10.7.2016 low to 12.15.2016 high looks impulsive and can be considered as such. We then see a 9 month sideways consolidation from 12.15.2016 to 8.24.2017. The pair then started a new leg higher and made recent peak at 9.21.2017. It has corrected and retested the upper end of the consolidation channel. The rally from 8.24.2017 to 9.21.2017 also looks like an impulse. From the overall structure, it looks like GBP/JPY is bullish and can continue higher to 161.76 – 168 area as far as it remains above 8.24.2017 low.


