Investing.com’s stocks of the week
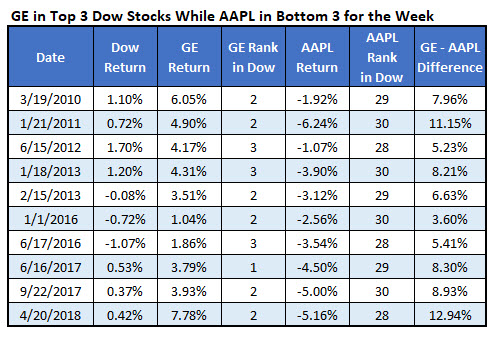
General Electric Company (NYSE:GE) stock was among the best of the Dow Jones Industrial Average (DJI) last week, punctuated by the conglomerate's stronger-than-expected earnings report on Friday. On the flip side, Apple Inc. (NASDAQ:NASDAQ:AAPL) stock was among the worst blue chips last week, amid concerns about the iPhone and ebbing smartphone demand. It was a definite role reversal for the pair of blue chips, sending up a signal we haven't seen yet in 2018. Here's how the Dow tends to perform when GE stock leads and AAPL lags.
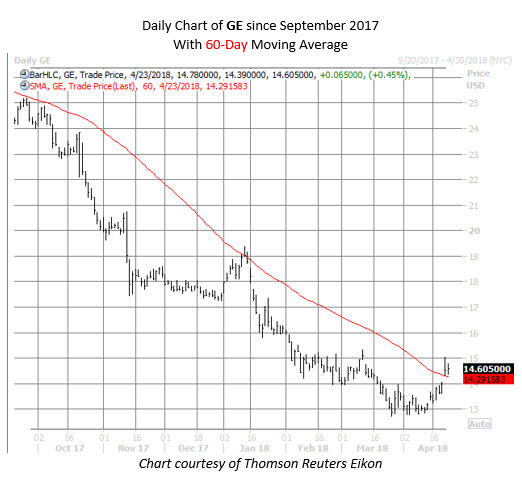
GE Looks to Snap Monthly Losing Streak
Specifically, General Electric stock gained 7.8% last week -- its best since the week of the November 2016 presidential election. For perspective, just last month, GE shares touched an eight-year low of $12.73, but are now trading at $14.60 -- back above their 60-day moving average for just the second time since June. Further, the blue chip is pacing for an April gain of 1.1%, set to snap its dismal monthly losing streak.
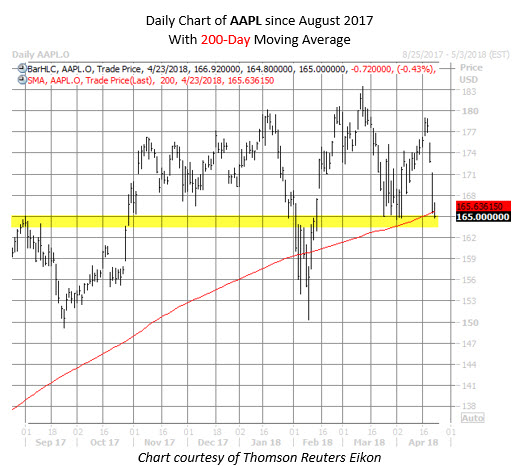
Apple's Worst Day Since February
Apple stock, meanwhile, fell 5.2% last week, and on Friday slid 4.1% -- its worst day since Feb. 2. AAPL shares are now trading around $165.00, set to end beneath their 200-day moving average for the first time since the February correction. However, the $164-$165 area previously acted as a ceiling for Apple stock in late 2017, but switched roles to contain a recent pullback. It also represents a 10% discount to the equity's March 13 record high of $183.50.
Biggest GE/AAPL Difference in At Least 8 Years
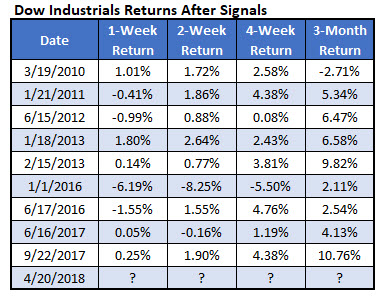
The last time that GE stock was among the top three Dow components for the week at the same time AAPL stock was in the bottom three was Sept. 22, 2017, according to Schaeffer's Senior Quantitative Analyst Rocky White. In fact, this "Freaky Friday" has happened just nine times since 2010, and last week's difference was the biggest of all.
'Freaky Friday' Could Spell Gains for Dow
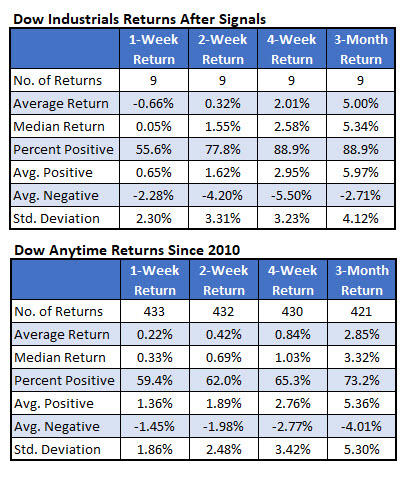
These signals have been bullish for the Dow index in the past. Although the DJI was down 0.66%, on average, one week later, the blue-chip barometer was up an average of 2.01% one month (four weeks) out. Further, the Dow was higher 88.9% of the time. That's more than double the index's average anytime one-week gain of just 0.84%, looking at data since 2010, with a win rate of just 65.3%.
Further, three months after GE and AAPL stocks lead and lag, respectively, the Dow was up 5%, on average! Again, the index was higher all but once, or 88.9% of the time, and that was back after the March 2010 signal. For comparison, the index sports an average anytime three-month gain of just 2.85%, with a win rate of 73.2%.
