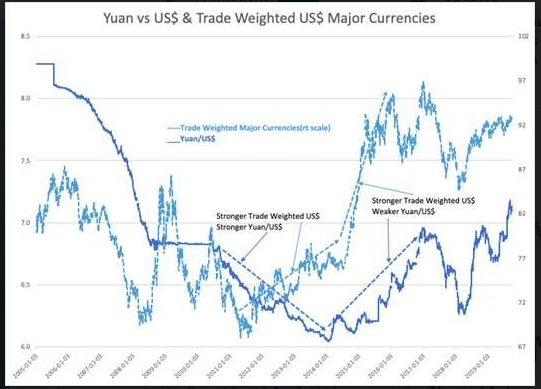
The basis for the rapid increase in negative rates is seen in the yuan versus the U.S. dollar compared to the trade-weighted USD relationship.
Daily data shows periods of yuan improving strength relative to the USD through 2013 even though the trade-weighted USD Index began to turn higher in 2010. The yuan continued to gain strength until the end of 2013 when it suddenly turned weaker with Russia’s invasion of Ukraine.
Little watched at the same time, one might even suspect it as a coordinated activity with Russia, was the beginning of China’s military expansion on the Spratly Islands. The first concerns were voiced in early 2015, “The South China Sea Transformed”. The yuan has weakened in steps as Xi’s actions shifted further away from the previously assumed Democratic path many thought China was on and towards autocratic leadership.
THE SOUTH CHINA SEA TRANSFORMED


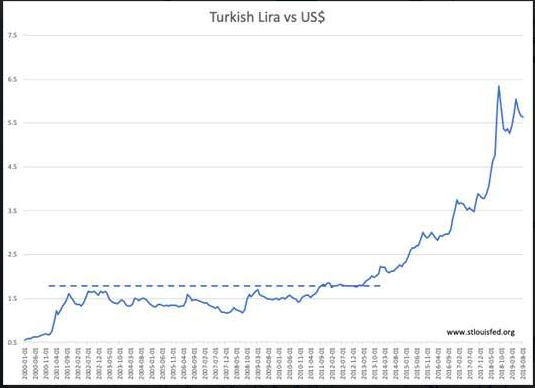
The only means available to track capital shifts due to government changes to individual property rights is through the currency exchange. The act of shifting capital from one currency to another seeking better/safer returns lowers the former and raises the latter. It is often the only early indicator of government leaders shifting against business and its citizens' welfare. Turkey is a good recent example of a shift against individual property. Recep Tayyip Erdoğan orchestrated himself to President of Turkey in 2014, but capital began to exit in 2013.
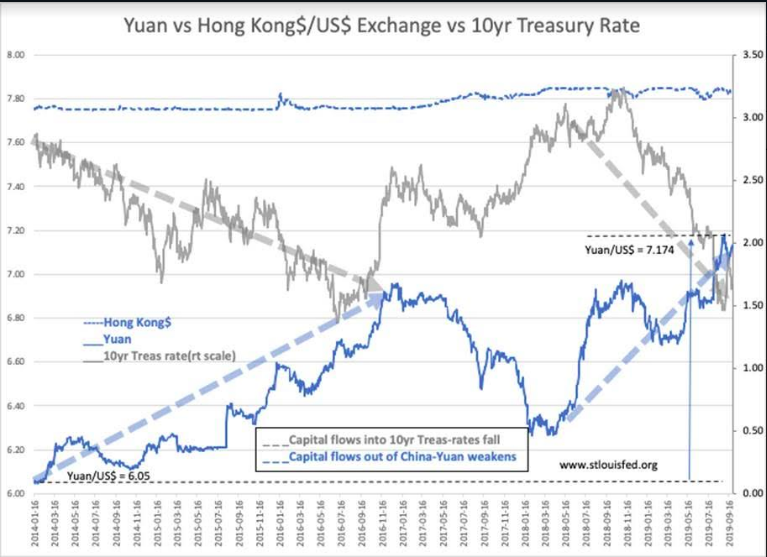
The amount of Western sovereign debt falling into negative rate territory has more than doubled in 2019. The cause is a flurry of autocratic shifts in important parts of the world almost appearing coordinated in 2014 by Russia, China and Turkey. Global banking systems make capital fungible and impossibe to identify as arising from any geopolitial event. Currency exchange rates are the only tool available coupled to media reports help to identify when governments shift favorably or unfavorably with respect to their citizens’ wealth. China with a reported GDP ~60% of the US is large enough to see the impact of capital shifts and exchange rate shifts on sovereign debt rates.
The updated daily data yuan versus Hong Kong dollar/U.S. dollar Exchange versus the 10-year treasury rate shows that the correlation has increased with the current tariff dispute and the Hong Kong protests.
