The South African rand drops 2.75% in one hour, as President Zuma may sack highly regarded Finance Minister, according to Bloomberg.
Following yesterday’s 3-percent collapse in the rand, today has been another emotional start with Bloomberg breaking a story that President Zuma has said he will sack Pravin Gordhan. For context, the rot started yesterday after Zuma recalled Mr Pravin from an investor roadshow in London. This naturally sent tongues wagging and investors rushing for the door as the rand fell 3% in one hour, much like this morning’s move.
Investors overseas and domestic alike, regard the Finance Minister highly despite his repeated clashes with Mr Zuma. The general feeling is that the only thing standing between South Africa and a multi-agency downgrade of its sovereign debt to junk status is Mr. Gordhan. This will have dire implications for South Africa, especially as Mr. Zuma seems intent on embarking on a Venezuela and Zimbabwe School of Economics policy to tackle inequality and poverty. Itself a very noble idea, but the execution of it has left both countries bankrupt and international pariahs.
In Venezuela’s case, the country with the largest proven oil reserves (it has more than Saudi Arabia) in the world sees its citizens queuing for food and petrol. Zimbabwe now uses the US dollar as its national currency after social unrest and hyperinflation-ravaged the country.
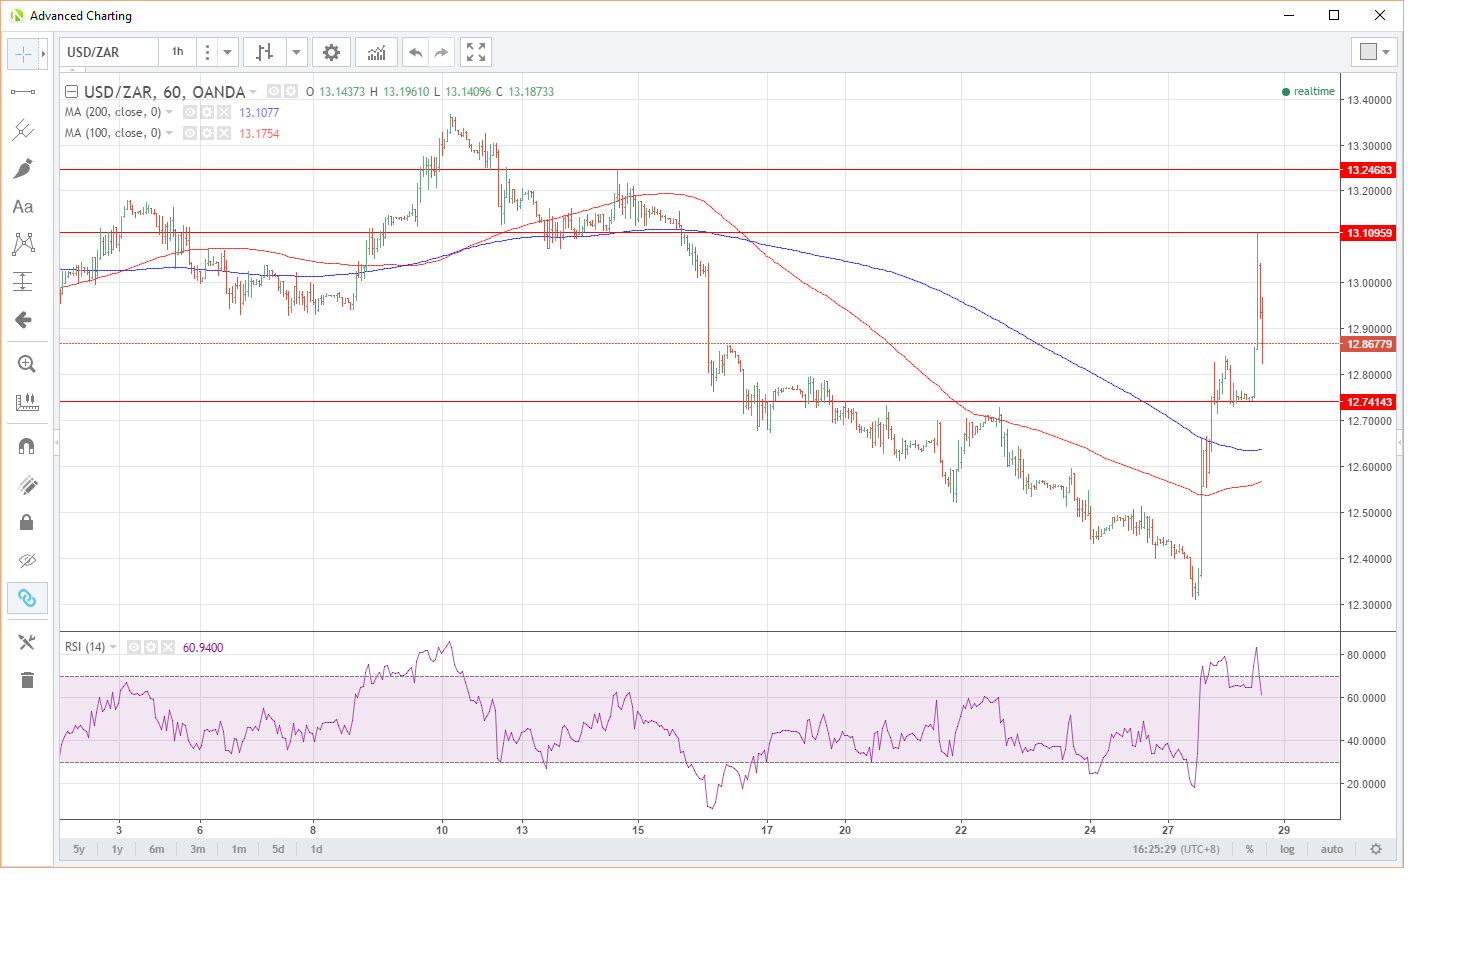
The rand dropped from 12.7500 to 13.1100 in a straight line and has rallied back 12.9350 as I speak. A look at the hourly chart below suggests that pullbacks should now be limited to 12.7400, today’s lows and an area of previous congestion.
Resistance is at 13.1100, today’s high and another area of previous congestion. The hourly RSI is still sitting at very overbought levels, and this may mean that the 13.1100 area may hold for now.
The hourly RSI is still sitting at very overbought levels and this may mean that the 13.1100 area may hold for now. We expect the currency to be very headline driven into European trading with the news that Mr Gorhan has just arrived back in Johannesburg.

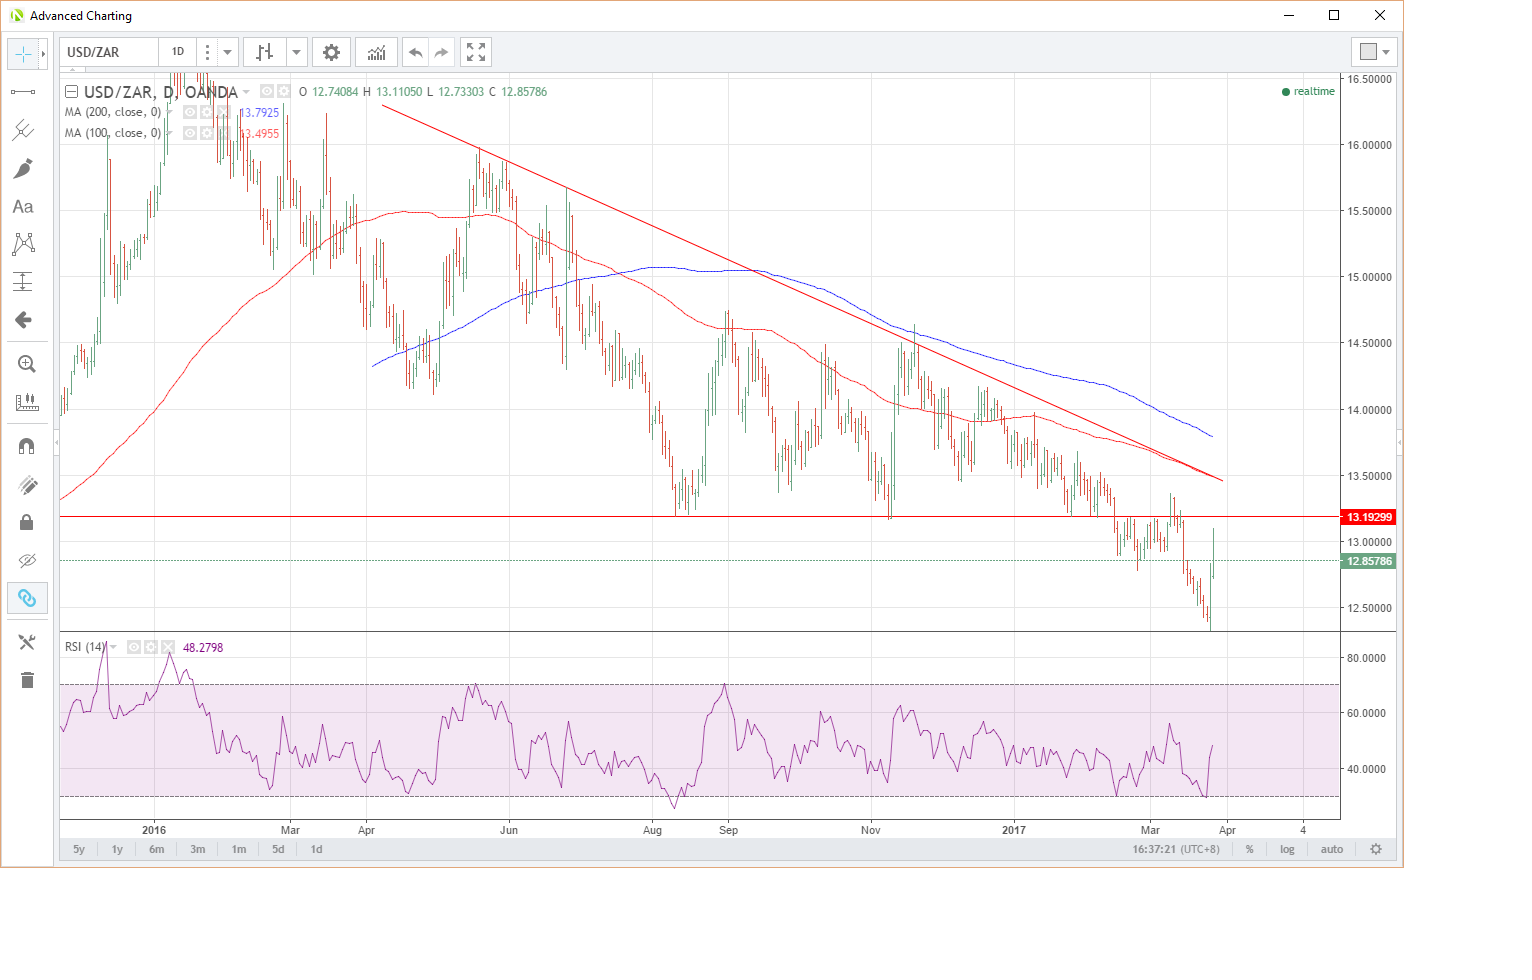
Looking at the daily chart, the USD/ZAR will still have some wood to chop.
At 13.4950 we have the 100-day moving average and a descending trendline from June 2016. Behind this at 13.7900 is the 200-day moving average.
More interestingly in the near term, the 13.2000 area appears to be the bottom of the continuation pattern descending triangle. Having broken out, the USD/ZAR should find resistance there as it has many times previously on a closing basis.

Summary
The situation is becoming “fluid” in South Africa. With the political uncertainty seeing the rand weaken and bond yields rise aggressively. Traders should stay near to their news feeds for now as the rand will move on headlines intraday. From a technical point of view, however, USD/ZAR is overbought in the short term and must overcome stiff resistance on the medium term charts. A firing of Gordhan and a downgrade to junk status may make all these points moot, however.
