Analyzing stock value traps is a highly qualitative process you need to do before you make an investment. But there are important quantitative things to look at, too, that will save time.
We’ve written about identifying stock value traps before, and a lot of the analysis you do to ensure your attractively-valued investment idea won’t just languish or drop further is interpretive. There’s no magic bullet to ensuring a stock will rise in value, but there are some quantitative analyses you should do to help avoid investing in a value trap.
Why would you want to do this? Well, qualitative analysis takes a lot of time. If you can rule a stock out as a value trap through a quantitative process, you can reduce the number of stocks you really need to dive into.
First, a quick reminder of the typical qualitative things you should look at.
Qualitative Stock Value Trap Analysis
Think about things like:
The Industry
The Company
Bloomberg has a pretty good list, too.
A lot of this comes from reading filings, earnings transcripts, etc., and really thinking about what it all means.
But there are some things you can analyze quantitatively, which Old School Value can help with.
Quantitative Stock Value Trap Analysis
Cost Structures
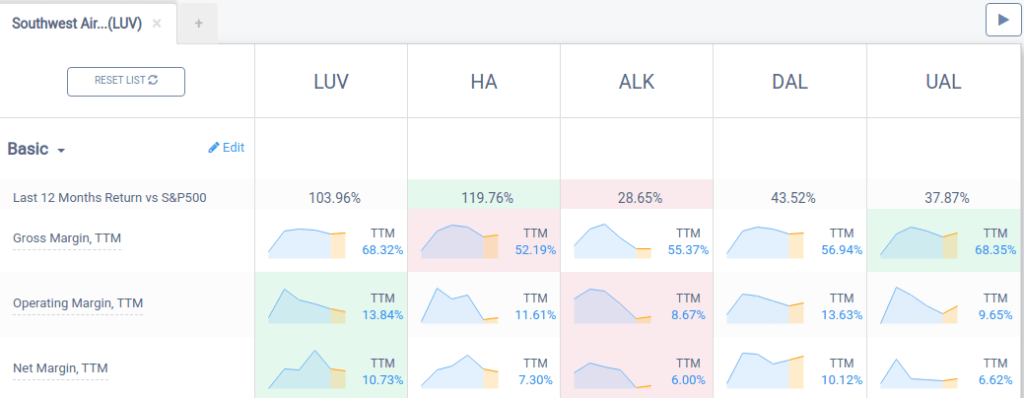
The structure of a company’s costs can make a big difference in how it behaves and how it performs. We've used Southwest Airlines (NYSE:LUV) as an example, below.
If your target company’s cost structure is noticeably different from the leaders in its industry, this is worth thinking about.
In the OSV Compare Competitors tab, it’s very easy to look at Gross Margin, Operating Margin, and Net Margin across competitors. Does your target stand out, or does the industry leader?
As revenue has increased or decreased, what’s happened to the margins?

A high fixed cost producer will see margins deteriorate quickly as revenues decline and could send it into a spiral. But, they will also see margins rebound just as rapidly if revenues turn around, which could be a catalyst.
A company with higher variable costs will be able to maintain its margins on the way up and down, which can reduce failure risk.
Quality
One of the biggest reasons a company may be a value trap is that it’s going to go out of business, or at least experience serious difficulties.
Dig into all of our Quality Checks these to make sure accounting is all good and the risk of insolvency is low. Look at everything from Piotroski F, Altman Z, and Beneish M Scores, DuPont Analysis, as well as the standard solvency and liquidity ratios.
You can see all the Quality Checks in our demo screener.
Insiders
Check out insider ownership and transactions.
On the Key Stats page, click Stats to get the insider ownership percentage, and click Insiders to get the transactions from the last 6 months.
If insider ownership is too high or too low, I’d consider it an issue. Too low, and there’s not enough management commitment. Too high, and outside institutional investors won’t have any influence in turning things around.
And, if insiders are selling stock as it’s going down, that’s worrisome. They wouldn’t be selling if they believed the company was undervalued and on the cusp of a renaissance.
Shorts
On the Stats page, I’d also look at the “Float Short” percentage. If there are a lot of shorts, I’d probably go look for why people are betting against this company and see if I agree.
I generally like to make my investment decisions without reading a lot of opinions from other people (at least until I’ve formed my own opinion and have moved to the “why am I wrong?” stage), but this is one place where I’ll make an exception. The “short cases” I’ve read in the past are often quite well researched. Perhaps that comes from the possibility of infinite losses.
Conclusion
Although there’s no substitute for evaluating a company and its industry from a qualitative perspective to determine for yourself if the prevailing narrative is reasonable, you can also look at the above more quantitative areas to see if it’s worth spending more time doing that additional analysis.
Like with a quantitative stock screener, doing a quantitative pass first on a stock that might be a value trap can save a lot of time!
