Volatility has returned to the stock market this week after a couple months of relative calm. Not surprisingly, the sharp wave of selling on Monday and Tuesday has reordered the horse race for primary equity factors. As a result, the so-called quality factor is the last man standing for outperforming the broad market year to date, based on a set of exchange-traded funds.
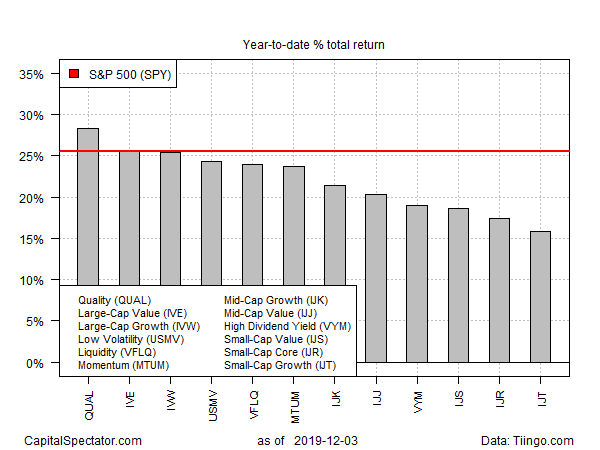
The iShares Edge MSCI USA Quality Factor ETF (NYSE:QUAL) is up 28.3% so far this year (through Dec. 3). Although the fund has taken a hit this week, courtesy of the broad-based selloff, QUAL is the only ETF on our factor list that’s still outperforming the market overall, based on SPDR S&P 500 (SPY (NYSE:SPY), which is ahead by 25.6% year to date.

Meanwhile, large-cap value (NYSE:IVE) and large-cap growth (NYSE:IVW) are essentially tracking SPY this year through yesterday’s close. The rest of the factor ETFs on our list are trailing the broad market. Small-cap growth (NASDAQ:IJT) finds itself in last place, albeit with a still-solid 15.8% total return for 2019 so far.
What’s the fuel behind QUAL’s outperformance? It’s tempting to attribute the relative strength to the crowd’s newfound fondness for companies with “positive fundamentals (high return on equity, stable year-over-year earnings growth and low financial leverage),” as the iShares profile of the fund relates. Perhaps, but since most of QUAL’s leadership was generated earlier in the year it’s likely that the real test still awaits. The key question: How will “quality” fare against the other factors in a sustained downturn? Stay tuned.
Meantime, this week’s selling suggests that QUAL isn’t immune to risk-off sentiment, at least in the short term. The fund closed down 1.5% at yesterday’s close relative to the end of trading last week – matching the market’s slide, based on SPY.

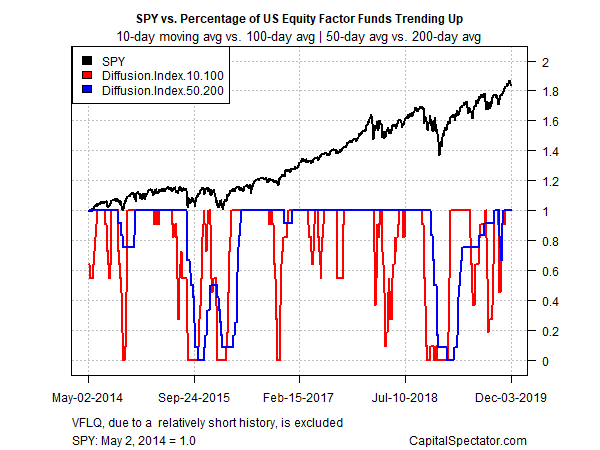
Stepping back and considering the momentum profile for all the factor funds listed above continues to show a strong upside bias. This week’s selling may be the start of a deeper reversal, but for the moment the bullish trend has only been lightly dented so far. Using two sets of moving averages shows that the year’s upswing has yet to take a hit. The first compares the 10-day moving average with its 100-day counterpart — a proxy for short-term trending behavior (red line in chart below). A second set of moving averages (50 and 200 days) represent the intermediate measure of the trend (blue line). As of Tuesday’s close, a bullish tailwind remains priced into all the factor funds.
