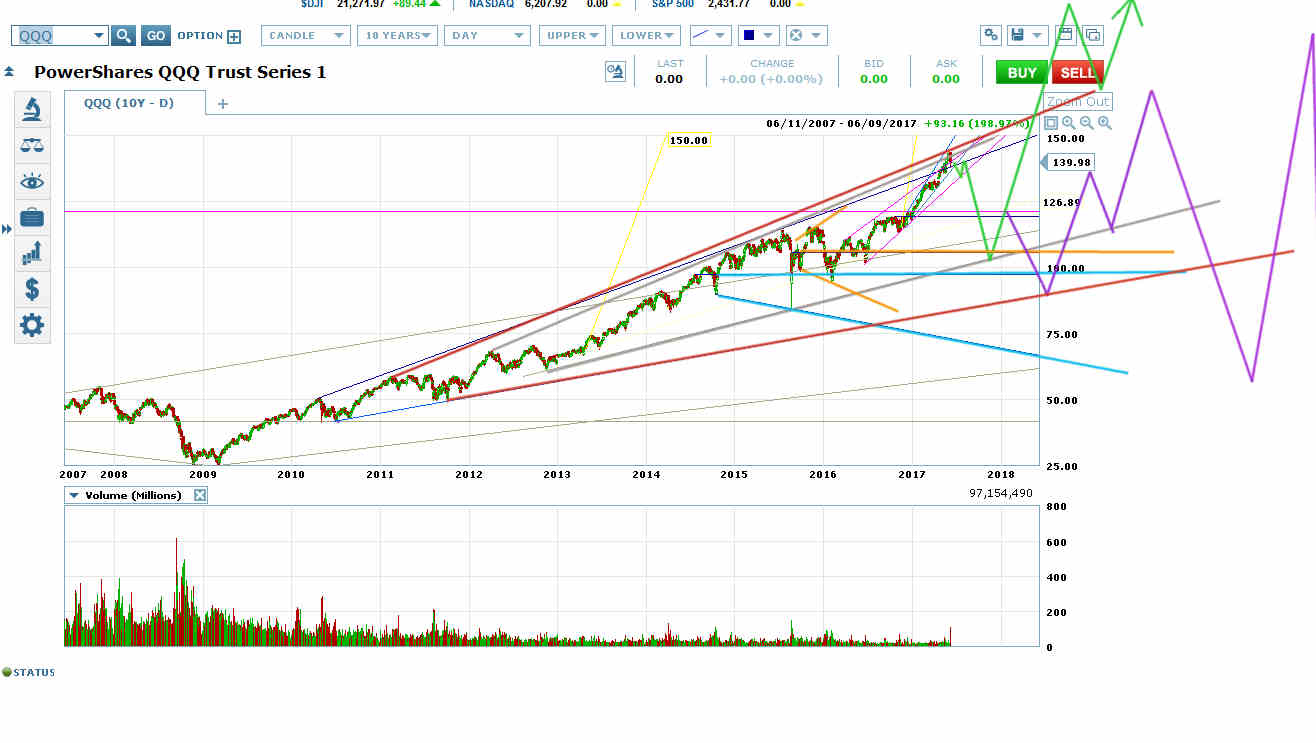
Biggest One-Day Slide Since August 2015 Suggests Deep Retrace of Move

On Friday PowerShares QQQ Trust Series 1 (NASDAQ:QQQ) Put In Its Biggest 1-Day Slide Since August 24, 2015 – That’s a Neely Signal
On Friday QQQ slid 5.79 points from the day’s high to low. That is the biggest one-day slide since August 24, 2015 (the capitulation move of the China bubble crash). That is a Neely signal that the move out of the August 24, 2015 low has just ended.
That suggests QQQ has started a deep retrace of that move. However, unless QQQ crashes more than 9.50 points on Monday, it suggests QQQ has higher to go after a partial retrace of that move.
QQQ reentered its pink rising wedge Friday and ended the day with a retest of its top. It’s likely to continue down to the rising wedge bottom and beyond to at least the orange megaphone VWAP and the bottom of the silver rising megaphone.
That will be a critical decision point.
Critical Decision Point will be at 105-106ish
QQQ could reverse hard at the silver rising megaphone bottom for a breakout upwards from the orange and light blue megaphones and the silver rising megaphone into a truly magnificent move up with a target of roughly 200 (green scenario).
Or QQQ could start a megaphone there (purple scenario) that breaks the price out of the silver rising megaphone to set up a new rising megaphone (red on chart). That would imply a new all-time high within the light blue megaphone and red rising megaphone, but not a move to 200. Instead, QQQ would likely be putting in a double wave up within the light blue megaphone and setting up a swing to its bottom.
The Larger Crash Scenario
If QQQ is going to put in a candle larger than 9.50 points on the correction to 105-106ish, it will likely do so as part of a price channel crash set-up that takes QQQ straight to the light blue megaphone bottom before another swing to its top.
The Bots
Studies show that high-frequency trading bots tend to suppress volatility. I don’t have enough data to know how this affects things like the Neely signal.
So even though this signal back tested well for decades, keep an open mind about the possibility of a megaphone starting here rather than an immediate correction.
The Price Action to Watch For
However, the price action usually won’t lie. If the market’s heading down from here to 105-106ish or beyond, the move would usually start as a price channel. In the critical decision wave, we’d usually see either a conventional breakout into a series of melt-down channels, or we’d see a large falling megaphone bottom start.
Large falling megaphone bottoms tend to break out of a price channel like a conventional melt-down set-up, then retrace all the way to the price channel top, then break down out of the channel past the first channel breakout.
Either could reverse at 105-106ish, but a falling megaphone would be a tell that a reversal there is a strong favorite.
