Markets rallied worldwide as the FED announced, thursday afternoon, an open ended QE 3 program. The FED plans to purchase MBS and USBs, at a rate of $40 bln/month, until they determine employment is improving and the economy is on solid ground. We fear the FED has now completed their normal cycle of undershoot, (not doing enough in 2008), to overshoot, (doing too much in 2012). During previous Quantitative Easing the FED announced their programs while the stock market and economy were heading lower. QE 1, ($75 bln/mth), was announced in March 2009 after the SPX had declined for 17 months and was at 720. QE 2, ($60 bln/mth), was announced in August 2010 after the SPX had lost 17% of its value and was at 1065. In both cases the economy was already in bad shape, (QE 1), or declining sharply, (QE 2). QE 3 was just announced with the stock market at bull market highs, and the economy already on the mend from its decline into its Q4 2011 low. While reviving the economy over the next year or so is probable. The price we may all pay, in the end, is inflation.
For the week the SPX/DOW were +2.05%, and the NDX/NAZ were +1.30%. Asian markets gained 2.8%, European markets gained 2.3%, and the DJ World index rose 3.0%. Economic reports continued to improve with positive ones outnumbering the negatives ten to six. On the downtick: consumer credit, import prices, industrial production, capacity utilization, while both weekly jobless claims and the budget deficit increased. On the uptick: trade deficit, export prices, wholesale/business inventories, the CPI/PPI, retail sales, consumer sentiment, the M1 multiplier and the WLEI. Next week we get a look at Housing, the NY/Philly FED and Leading indicators. Best to your week!
Long Term: Bull Market
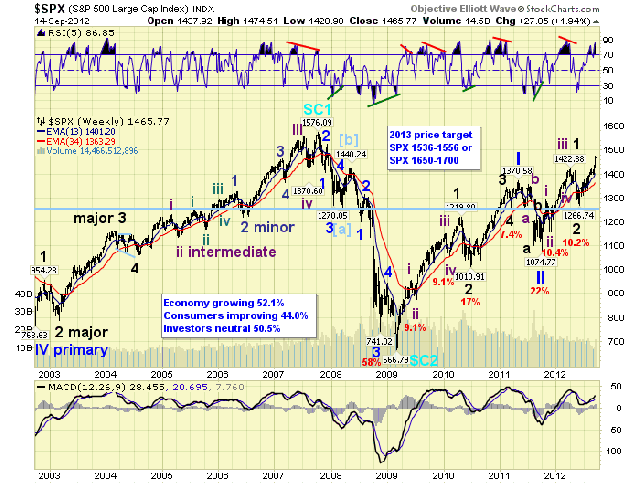
For about one year we have been calling for a bull market high around mid-late 2013 between SPX 1536 and 1556. With the FED’s announcement of an open-ended QE 3 this week, we believe forecasting a top of this bull market, in price, has now become more difficult. The OEW waves, however, have tracked this bull market quite well. With the combination of the waves/trends, and our technical/fundamental indicators, we should be able to ride this bull market until it finishes.
For now, we will maintain our time window of mid-late 2013. Yet we believe the bull market will end about one to three months before QE 3 ends. The reason for this is the market’s previous reaction to the ending of QE programs. The market initially topped in Apr10 when QE 1 was ended in Jun10. The market also topped in Mar/May11 when QE 2 was ended in Jun11. The market is quite likely to repeat this same pattern.
SPX Target
In regard to price, we will again maintain our SPX 1536 to 1556 target. Yet we believe this is now a minimum range rather than a maximum range for a bull market top. In fact, we would not be surprised if the market approached this range in 2012. Should this occur our bull market price target will be raised to SPX 1650-1700. We noted this change on the weekly chart.
The technicals for this bull market continue to track quite well. The MACD has remained mostly above neutral, similar to the 2002-2007 bull market. Plus, the RSI continues to get extremely overbought during uptrends, and only slightly oversold during downtrends. Currently both the MACD and RSI are still rising, suggesting further upside price activity ahead.
Wave Count
Our wave count continues to unfold as expected. This is a five Primary wave Cycle wave [1] bull market. Primary wave I consisted of five Major waves, with Major 1 subdividing into five Intermediate waves. After Primary I topped at SPX 1371, and Primary II bottomed at SPX 1075, Primary wave III was underway. Primary III is also unfolding in five Major waves, with a subdivided five Intermediate wave Major wave 1. Major wave 1 completed at SPX 1422/15 and Major 2 completed at SPX 1267. Major wave 3, this uptrend, has been underway since that low.
Medium Term: Uptrend New High, SPX 1475
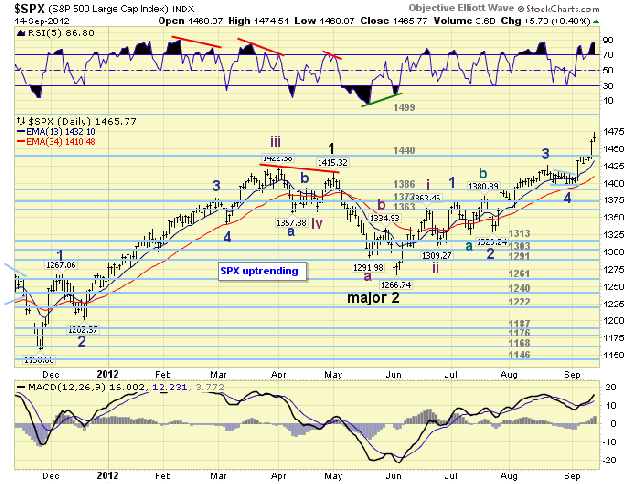
After the Major wave 2 low at SPX 1267 this current uptrend, Major wave 3, was underway. The initial rally to SPX 1363, and pullback to SPX 1309, was quite normal. After that the market became somewhat choppy for about one month. Then it started impulsing again. Since this is a Major wave 3 uptrend, we have been counting the five Intermediate waves that creates it. Intermediate wave i was, as noted above, SPX 1267-1363. Intermediate wave ii then bottomed at SPX 1309. Intermediate wave iii has been underway since that low.
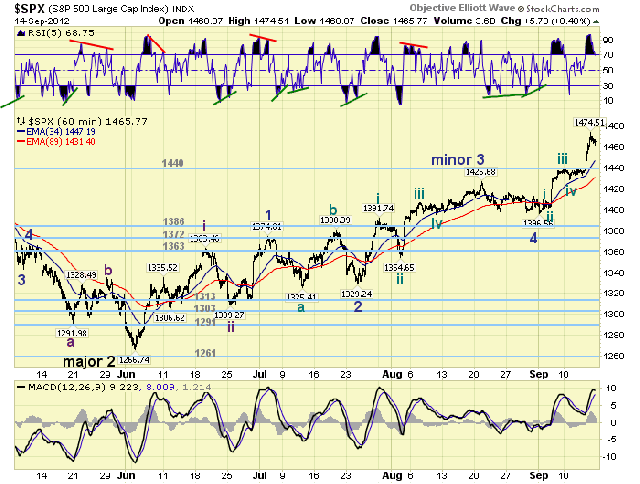
Intermediate wave iii started to subdivide, into five Minor waves, around the time the market started to get choppy. Minor wave 1 ended at SPX 1374, Minor 2 ended at SPX 1329 in an irregular failed flat, Minor wave 3 ended at SPX 1427, Minor 4 ended recently at SPX 1397, and Minor wave 5 has been underway since then. The hourly chart displays this waves quite well. Within Minor wave 3 we also counted five Minute waves. This subdivision structure is also appearing in Minor wave 5.
Our original target to complete Minor 5 and also Intermediate wave iii was SPX 1463/64. At this level Int. iii = 1.618 Int. i, and Minor 5 = Minor 1. The market broke through this level on friday as it reached SPX 1475. The next fibonacci resistance area is SPX 1493/95. At this level Minor wave 5 = Minor 3 and Int. i. This is also within the range of the long term OEW 1499 pivot. This pivot should therefore offer more resistance than the SPX 1463/64 area. Should this pivot be reached during Intermediate wave iii, we would raise our target area for Major wave 3, this uptrend, to the OEW 1523 long term pivot. Medium term support is at the 1440 and 1386 pivots, with resistance at the 1499 and 1523 pivots.
Short Term
Short term support is at SPX 1463/64 and the 1440 pivot, with resistance at the 1499 and 1523 pivots. Short term momentum hit its highest level during the entire bull market on friday, (RSI 98%), then declined to just under overbought by the close. The short term OEW charts remain positive from SPX 1412, with the swing point now at SPX 1440.
Our count for Minor wave 5 count appears to have gone quite well. In fact, the entire uptrend has progressed quite nicely. We can count five Minute waves up from the Minor 4 low at SPX 1397, and Minor 5 may have completed on friday. Should the lower range of the current SPX 1463/64 support area, (1456-1471), fail to hold, then Intermediate wave iii likely ended at SPX 1475. 
Support for Intermediate wave iv would begin at the 1440 pivot. Then regress to SPX 1422/27, 1413/16 or even 1402/03. Since fourth waves during this bull market have been relatively small, we believe the 1440 pivot range should hold for Int. wave iv support. Should this rally continue to the 1499 pivot, ending Int. iii, we still feel the OEW 1440 pivot range should still hold support for Int. wave iv. After Intermediate wave iv concludes we will still have a rising Intermediate wave v before this uptrend ends. Originally we expected this uptrend to end by late 2012 around the OEW 1499 pivot. The timing should still work out well, but this uptrend, Major wave 3, could continue higher to the OEW 1523 pivot or even the OEW 1552 pivot. It all depends on how much sideline money is put to work in the stock market. The 1552 pivot, btw, fits within the SPX 1536-1556 target noted much earlier in this report.
Overall the trend is up and the FED is fueling the shift back into risk assets. We’ll just have to deal with the potential consequences when/if they arrive. Best to your trading!
- English (UK)
- English (India)
- English (Canada)
- English (Australia)
- English (South Africa)
- English (Philippines)
- English (Nigeria)
- Deutsch
- Español (España)
- Español (México)
- Français
- Italiano
- Nederlands
- Português (Portugal)
- Polski
- Português (Brasil)
- Русский
- Türkçe
- العربية
- Ελληνικά
- Svenska
- Suomi
- עברית
- 日本語
- 한국어
- 简体中文
- 繁體中文
- Bahasa Indonesia
- Bahasa Melayu
- ไทย
- Tiếng Việt
- हिंदी
QE3 And The Equity Bull Market
Published 09/19/2012, 07:11 AM
Updated 07/09/2023, 06:31 AM
QE3 And The Equity Bull Market
Review
Latest comments
Loading next article…
Install Our App
Risk Disclosure: Trading in financial instruments and/or cryptocurrencies involves high risks including the risk of losing some, or all, of your investment amount, and may not be suitable for all investors. Prices of cryptocurrencies are extremely volatile and may be affected by external factors such as financial, regulatory or political events. Trading on margin increases the financial risks.
Before deciding to trade in financial instrument or cryptocurrencies you should be fully informed of the risks and costs associated with trading the financial markets, carefully consider your investment objectives, level of experience, and risk appetite, and seek professional advice where needed.
Fusion Media would like to remind you that the data contained in this website is not necessarily real-time nor accurate. The data and prices on the website are not necessarily provided by any market or exchange, but may be provided by market makers, and so prices may not be accurate and may differ from the actual price at any given market, meaning prices are indicative and not appropriate for trading purposes. Fusion Media and any provider of the data contained in this website will not accept liability for any loss or damage as a result of your trading, or your reliance on the information contained within this website.
It is prohibited to use, store, reproduce, display, modify, transmit or distribute the data contained in this website without the explicit prior written permission of Fusion Media and/or the data provider. All intellectual property rights are reserved by the providers and/or the exchange providing the data contained in this website.
Fusion Media may be compensated by the advertisers that appear on the website, based on your interaction with the advertisements or advertisers.
© 2007-2025 - Fusion Media Limited. All Rights Reserved.