New data from BP (LON:BP) have provided a summary of the state of the global liquefied natural gas (LNG) market in 2016. The market remained oversupplied, but the extent of oversupply increased. Global LNG supply rose by 6.5%compared to virtually zero growth over 2011-2015. Demand growth increased by 4.2%, its fastest rate in the past five years.Amidst these market shifts, Qatar maintained its position as the world’s largest and most cost-efficient producer, accounting for 30.1% of global supply and capturing part of the new demand growth. The commitment to boost long-term production will solidify its position as the global LNG leader.
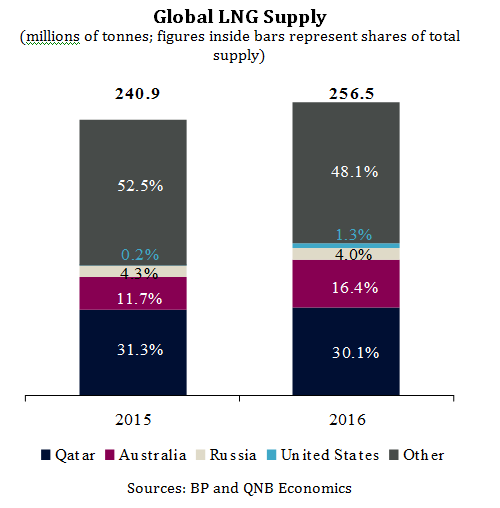
There were four major market developments in 2016. First, supply growth was led by a surge in Australian exports. Exports from Australia increased by 49.0% and represented nearly 90.0% of the increase in global supply. This reflects over USD200bn in past investments and the completion of the first phases of mega projects, launched several years ago when prices were higher. Australia is now the world’s second largest LNG producer and accounted for 16.4% of supply in 2016.
Second, the US began its first major international LNG shipments in 2016.The majority of its exports went to Latin American countries, particularly Chile and Mexico. Although it remains a small share of global supply, the US entry into the LNG export market represents a major shift.
Third, demand was propelled by China and Africa, more than offsetting weaker demand from Japan and South Korea. Chinese LNG imports rose by a colossal 33.0%. The rapid increase reflected the Chinese authorities’ goals to decrease reliance on coal and increase consumption of gas, one of the cleanest fossil fuels. African imports of LNG nearly tripled in 2016, drawn by lower prices, weak inter-regional pipeline infrastructure and rapid population growth.These increases more than compensated for a 2.0% decline in imports from Japan and flat import growth from South Korea, the world’s largest LNG importers. A desire to reduce reliance on LNG, cheaper prices of alternative energy sources and weaker power demand contributed to slower demand growth from the two countries.

(millions of tonnes; figures inside bars represent shares of total supply)
Sources: BP and QNB Economics
Fourth, Qatar remains the number one LNG player in the world despite higher supply from Australia and the US. Qatar’s share of global LNG supply stood at 30.1% as it captured nearly 70.0% of the new African demand, more than compensating for the lower cargoes to Japan. Qatar’s position is likely to be cemented by its recent decision to boost production by 30% over the next 5-7 years.
The four developments have important implications going forward. Production from the US and Australia is expected to increase substantially, maintaining the state of excess supply in the market.But subsequently, rising demand from Asia, a concerted global effort to adopt cleaner sources of energy and deferred investments are widely expected to push the market back into balance, potentially even into undersupply, around 2020. Qatar, as one of the most nimble and cost-efficient producers, is well positioned to take advantage by boosting its production as the market rebalances.
