
PVH Corp (NYSE:PVH) delivered fourth-quarter fiscal 2018 results, with earnings and revenues beating the Zacks consensus Estimate. In fact, this marks the company’s 19th straight quarter of bottom-line beat. Further, management issued an optimistic guidance for first quarter and fiscal 2019. These positives were enough to boost investors’ sentiments in the stock, which gained almost 10% in the after-hours trading session on Mar 27.
However, the top line declined during the quarter due to unfavorable year-on-year comparison, stemming from the inclusion of 53rd week in 2017. Tough year-over-year comparisons also impacted results in the Calvin Klein and Heritage Brands segments.
Q4 Highlights
PVH Corp’s adjusted earnings per share were $1.84, which included adverse currency impacts of 9 cents. The bottom line grew nearly 16.5% year over year and surpassed the Zacks Consensus Estimate (and the company’s previous earnings view) of $1.75.
On a GAAP basis, the company’s earnings were $2.09, up 50% from $1.39 in the year-ago quarter. Also, the figure surpassed management’s guidance of $1.54-$1.56.
In the fourth quarter, revenues declined almost 1% to $2,484 million. The downside was caused by an unfavorable year-on-year comparison as fiscal 2017 included an additional 53rd week. Notably, revenues fell nearly $125 million, which included $80 million impact from one lesser week in the fourth-quarter fiscal 2018 and $45 million from the fiscal calendar misalignment in fiscal 2018.
Nevertheless, on a constant-currency (cc) basis revenues depicted an improvement of 2%. The top line also surpassed the Zacks Consensus Estimate of $2,411 million as well as management’s earlier projection of $2.40 billion.
The company’s total gross profit fell roughly 1% to $1,355.5 million and gross margin contracted almost 20 basis points (bps) to 54.6%. Nonetheless, adjusted EBIT was up 9.3% to $193.1 million, including adverse currency impacts of nearly $8 million. Adjusted EBIT growth was backed by improvements in Calvin Klein and Tommy Hilfiger businesses, somewhat countered by soft Heritage Brands business and rise in corporate expenses.
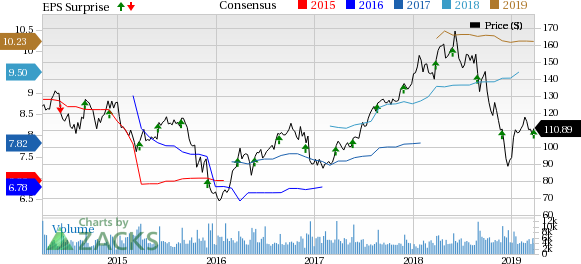
PVH Corp. Price, Consensus and EPS Surprise
Segment Analysis
PVH Corp reports financial results under three segments — Calvin Klein, Tommy Hilfiger and Heritage Brands. Comparable store sales (comps) across these categories for the reported quarter were computed on a shifted basis to adjust for the additional week in 2017.
Revenues at Calvin Klein declined 2% year over year (flat at cc) to $953 million. The downside was caused by negative impacts of almost $50 million from the inclusion of 53rd week in fiscal 2017. Nevertheless, the segment’s International sales rose 2% (up 6% at cc) to $523 million. International comps improved 6% on a shifted-basis. Further, the segment’s North America sales were down 7% to $430 million due to unfavorable year-on-year comparison as well as persistent weakness in the CALVIN KLEIN JEANS. Comps in this region inched down 1% on a shifted basis.
We note that this Zacks Rank #4 (Sell) company is grappling with continued weakness in the Calvin Klein banner. However, management is on track with prudent action to address the challenges in this category.
Revenues in the Tommy Hilfiger segment improved 2% (up 5% at cc) to $1.2 billion. Performance in this category improved despite an adverse $60-million impact from the 53rd week in 2017. International revenues in the segment increased 3% (up 7% at cc) to $721 million. The improvement was driven by a stellar performance in all regions and channels as well as comps growth of 16% on a shifted basis. Additionally, the category’s North America business witnessed revenue growth of 2% to $447 million, with comps rise of 5% on a shifted basis.
The Heritage Brands segment’s revenues declined 5% year over year to $363 million, including adverse impacts from the 53rd week in 2017 of nearly $15 million. Comps in the segment were flat on a shifted basis.
Share Repurchase
In fiscal 2018, the company bought back roughly 2.2 million shares for $300 million under its $1.25-billion buyback authorization through Jun 3, 2020. Since its inception, the company has repurchased nearly 9 million shares for $992 million as part of its commitment to return value to shareholders.
On March 26, 2019, management authorized an additional $750 million to its existing repurchase program and extended its duration to June 3, 2023.
FY19 Guidance
Management’s guidance for fiscal 2019 includes the assumption that two of its pending buyouts — Gazal Corporation Limited and Dickson Concepts — will be completed in second-quarter fiscal 2019. These businesses are anticipated to augment revenues during the fiscal by almost $150 million.
That said, the company projects revenues to increase 4% (up 5% at cc) during the fiscal. Brand-wise, sales are anticipated to increase roughly 6%, 2% and 3% for Tommy Hilfiger, Calvin Klein and Heritage Brands businesses, respectively. Moreover, sales at Tommy Hilfiger and Calvin Klein are likely to grow 8% and 3% at cc, respectively.
Net interest expenses are expected to increase nearly $128 million, up from $116 million incurred in fiscal 2018, thanks to increased short-term borrowing that are likely to stem from the pending buyouts. Further, adjusted effective tax rate is projected in the band of 14.5-15.5%.
Adjusted earnings per share (EPS) are envisioned in the range of $10.30-$10.40 for fiscal 2019. The guidance reflects an increase from $9.60 earned in fiscal 2018. Also, the mid-point of management’s projected range ($10.35) is currently above the Zacks Consensus Estimate of $10.23.
GAAP EPS are projected to be $8.90-$9.00, reflecting a decline from $9.65 reported in 2018. Earnings projections include negative impacts of roughly 22 cents per share from foreign currency translations on a GAAP and non-GAAP basis.
Q1 Guidance
For first-quarter fiscal 2019, the company expects total revenues to increase nearly 2% year over year and 6% at cc. Brand-wise, revenues are expected to increase 1% (up 5% at cc) at Calvin Klein, 4% (up 10% at cc) at Tommy Hilfiger and 1% at Heritage Brands.
Net interest expenses are anticipated to rise to roughly $31 million in the fiscal first quarter. The adjusted effective tax rate for the quarter is anticipated in the range of 21-22%.
Adjusted EPS are expected to be $2.40-$2.45, up from $2.36 in the year-ago quarter. The current earnings guidance is pegged above the Zacks Consensus Estimate of $2.39.
On a GAAP basis, the company envisions EPS in the range of 25-30 cents compared with $2.29 in the prior-year quarter. GAAP and adjusted earnings guidance include an anticipated adverse impact of nearly 14 cents from foreign currency.

Price Performance
Due to persistent softness in the Calvin Klein business and other hurdles, the company’s shares are declining. Notably, the stock has lost 21.4% in the past six months, compared with the industry’s decline of 6.7%.
Better-Ranked Consumer Discretionary Stocks
Columbia Sportswear Company (NASDAQ:COLM) has an expected long-term earnings growth rate of 10.9% and flaunts a Zacks Rank #1 (Strong Buy). You can see the complete list of today’s Zacks #1 Rank stocks here.
Ralph Lauren Corporation (NYSE:RL) pulled off an average earnings beat of 7% in the trailing four quarters and boasts a Zacks Rank #1.
Under Armour, Inc. (NYSE:UAA) is a Zacks Ranked #2 (Buy) stock that has an impressive long-term earnings growth rate of 22.7%.
Zacks' Top 10 Stocks for 2019
In addition to the stocks discussed above, would you like to know about our 10 finest buy-and-holds for the year?
Who wouldn't? Our annual Top 10s have beaten the market with amazing regularity. In 2018, while the market dropped -5.2%, the portfolio scored well into double-digits overall with individual stocks rising as high as +61.5%. And from 2012-2017, while the market boomed +126.3, Zacks' Top 10s reached an even more sensational +181.9%.
See Latest Stocks Today >>
Ralph Lauren Corporation (RL): Free Stock Analysis Report
PVH Corp. (PVH): Free Stock Analysis Report
Under Armour, Inc. (UAA): Free Stock Analysis Report
Columbia Sportswear Company (COLM): Free Stock Analysis Report
Original post
Zacks Investment Research