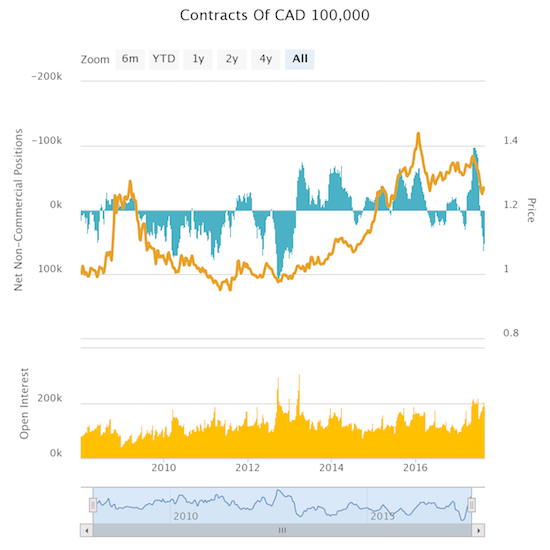
Currency speculators have not been this bullish on the Mexican peso in about four years. The Canadian dollar (Guggenheim CurrencyShares Canadian Dollar (NYSE:FXC)) has enjoyed such bullishness for a year longer.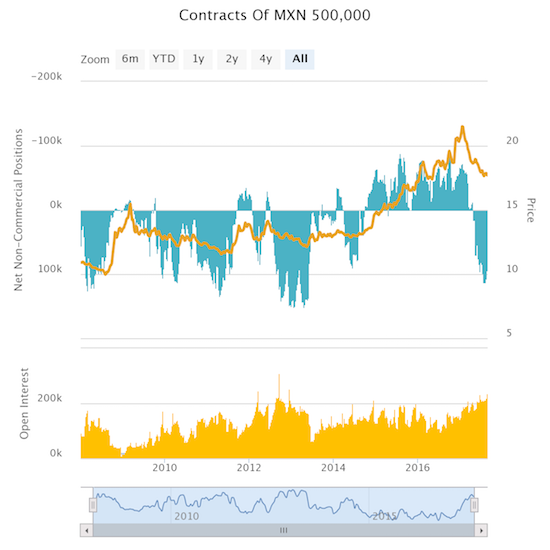
In 2017, the Mexican peso broke its longest post-recession spell of bearishness. How long will traders keep up this mood swing?
In 2017, currency traders swung sharply from a bout of maximum bearishness on the Canadian dollar to a bullishness unseen in years.
I have traded alongside these bulls for several months now, but I decided this past week to pull in the reins because of looming geo-political uncertainties.
At a rally in Phoenix, AZ, President Donald Trump predicted that the U.S. might have to dump NAFTA, the North America Free Trade Agreement. No word yet confirming Trump’s seriousness on the matter, and the peso and loonie held relatively steady through the headlines. Still, the remarks reminded me that these NAFTA negotiations present a real risk in trading both currencies.
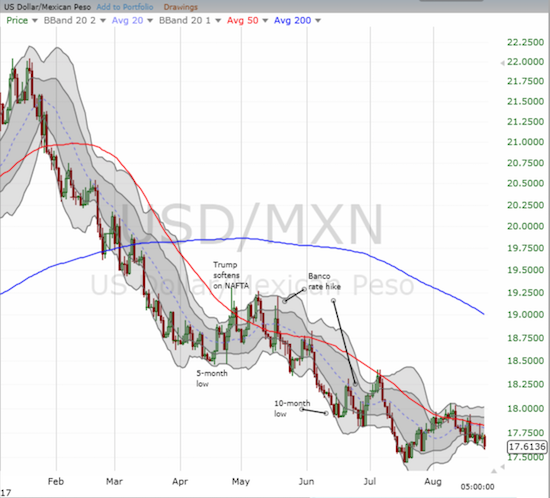
Since news flow will likely be very spotty and sporadic during the negotiations, I assume very short and/or small trades should still be OK. However, I see too much risk in extended strategies like accumulating a short in USD/MXN by fading rallies. My last such trade stretched out for its longest duration yet: almost a full month. I can take a hint.
The Mexican peso has taken advantage of U.S. dollar weakness with an extended downtrend all year. However, USD/MXN has gone over a month without a new low which means the downward pressure has eased for now.
Like USD/MXN, USD/CAD has yet to make a new low in a month. This is the longest such stretch in the almost four months USD/CAD has trended downward. Unlike the Mexican peso, the Canadian dollar spent little time retesting resistance at the downtrending 50-day moving average (DMA) against the U.S. dollar. If it were not for the NAFTA uncertainty, I would readily bet on a fresh breakdown for USD/CAD.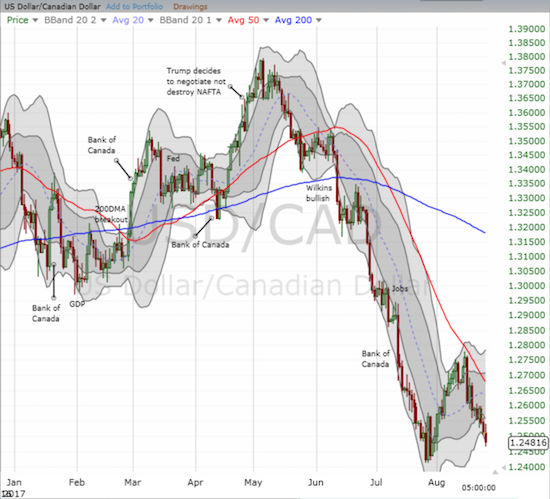
USD/CAD seems poised to break the last low in July. Such a fresh breakdown would confirm the downtrending 50DMA resistance.
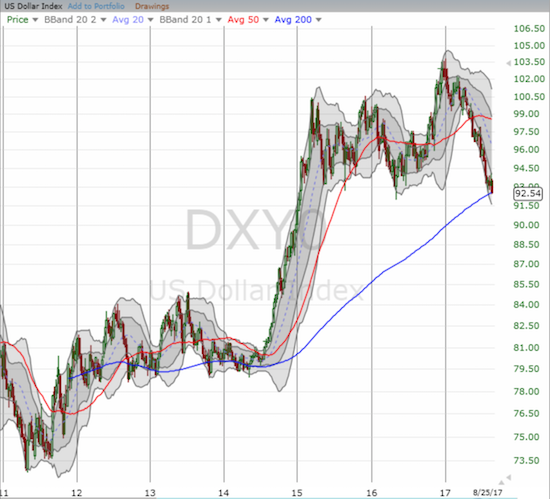
For reference, here is a chart of the U.S. dollar index. Thanks to the speeches at the central bank confab at Jackson Hole, WY, the dollar cracked a new low for the year. It has not closed this low since January, 2015. Strength in the euro (Guggenheim CurrencyShares Euro (NYSE:FXE)) was the primary driver pushing on the U.S. dollar. Yet, from reading ECB President Mario Draghi’s speech at Jackson Hole, I have no idea why traders took it as a signal to bid up the central currency.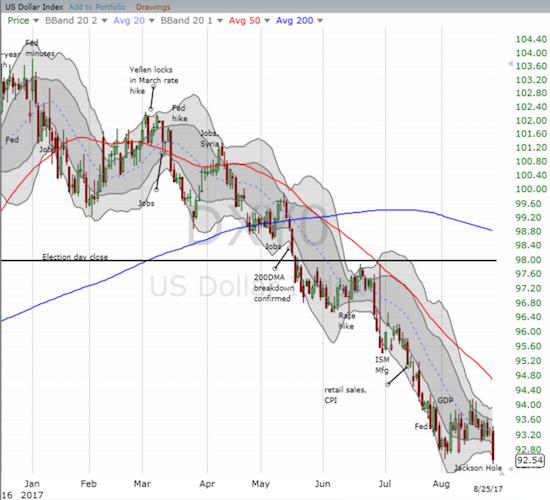
The first day of the central bank confab in Jackson Hole, WY reinforced the on-going weakness in the U.S. dollar index (DXY0)
This weekly chart shows the U.S. dollar at the edge of a very critical breakdown.
The weekly chart makes me think the downtrend from the 14-year peak has become over-stretched; meaning USD/MXN and USD/CAD could bounce sharply upward at any time. Then again, the run-up from 2014 to 2015 lasted longer and at many times took on a steeper angle. I will be monitoring the currency market in the coming weeks more closely than ever.
Full disclosure: No positions

