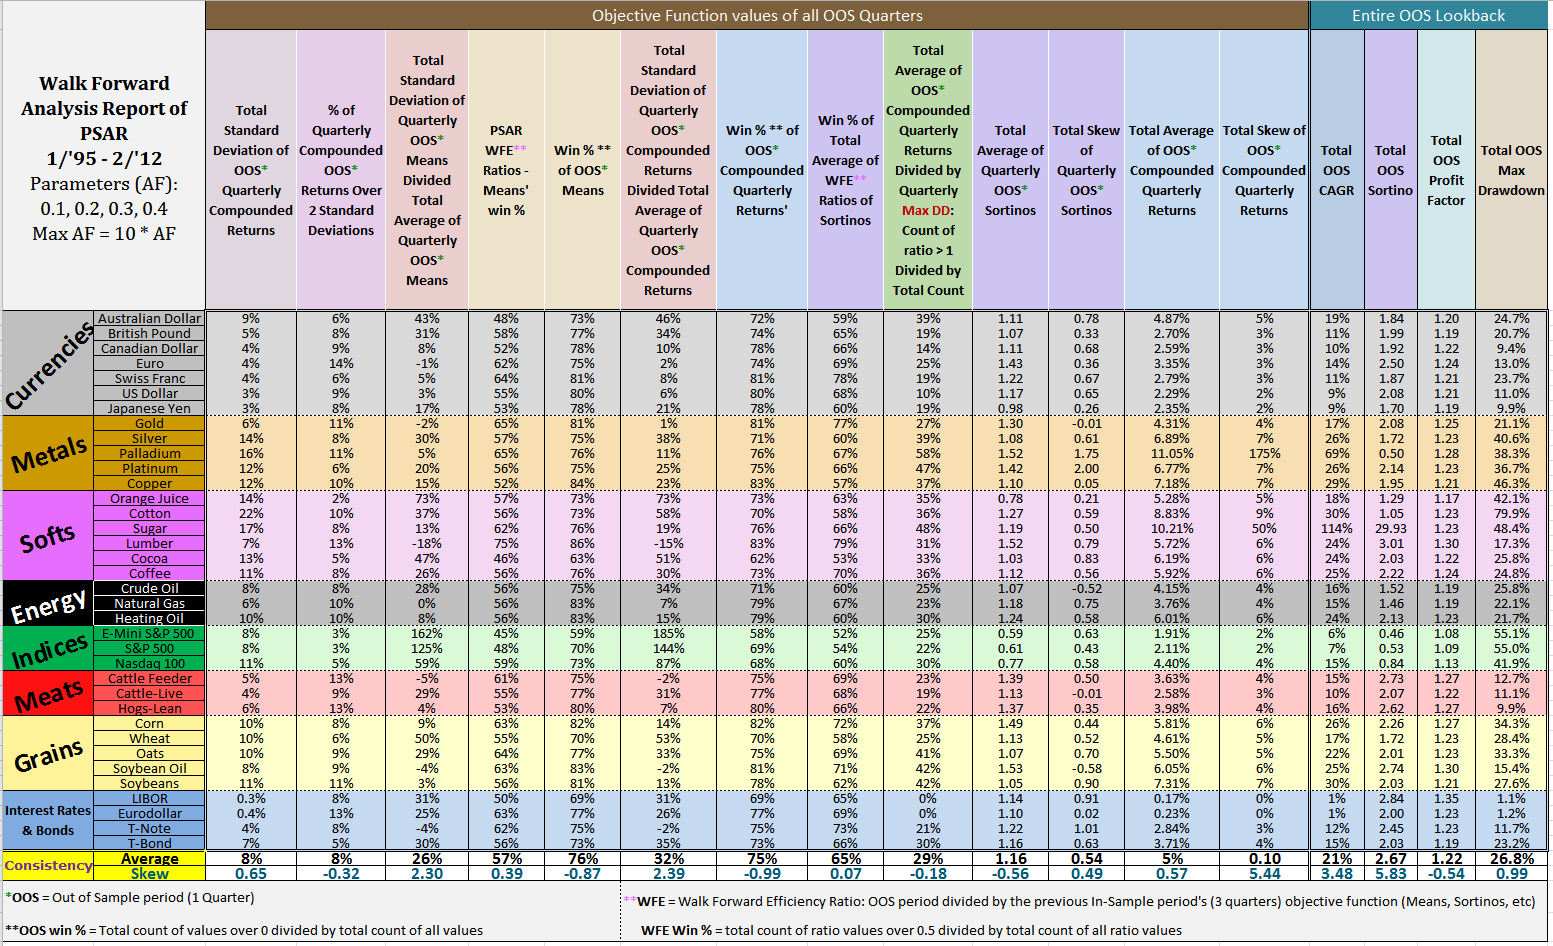
After months of researching and coding and much help from Jeff Pietsch, I have finally completed the basic Walk Forward Test!
The test is the classic by-the-book version for now. Later, I’ll try out other versions suggested by Jeff Pietsch, AKA Market Rewind. I wanted to have the basic version available so I can build all the other versions based on this one.
OK so I’ll try to clarify what’s going on in this report:
In this test the algo back tests performance measures of each of the 4 parameters (0.1, 0.2, 0.3, & 0.4) for a 3 quarter period. This is the In-Sample period or test period. Then it checks which parameter had the highest performance measure, in this case it’s the Sortino ratio, and “trades” the next quarter with that parameter, starting from the very next day after the last day of the In-Sample period. This is the Out-of-Sample (OOS) period. On the last day of each OOS period a new In-Sample period ends. This In-Sample period overlaps the previous OOS period and starts 1 quarter after the first day of the previous In-Sample period.
The inventor of this test, Robert Pardo, had a few methods of determining whether the test is robust:
- The WFE Ratio: Walk Forward Efficiency Ratio is the total OOS mean divided by the previous In-Sample mean.
- Consistency Test: Determining whether there is an absence of concentration of performance from each objective function’s time series for the : profit vs. loss, wins vs. losses, long vs. short trades and winning vs. losing runs.
I ran my own version of the WFA (Walk Forward Analysis) report by adding many more performance measures to the WFA report besides total returns, win/loss ratios, etc (starting from the first column on the left) and splitting their lookback periods in 2: quarterly and daily. The WFA ratios consist of OOS to In-Sample means and Sortinos.
In the quarterly lookback I averaged each of the 3 quarters’ objective function values instead of total 3 quarter results because otherwise the compounding effect of 3 quarters vs. 1 quarter would make an illogical comparison for a ratio between OOS and In-Sample for a WFE ratio of compounded returns. I applied this method for all of the quarterly lookback WFE ratios.
Overall, the PSAR has some pretty decent results.
The positives:
- OOS Sortinos averaged at 1.16 for quarterly and 1.22 for daily with a little positive skew. Overall skew for all assets’ Sortinos was slightly negative.
- Median daily CAGRs averaged at 21% with a median at 17%.
- 3/4 of quarterly compounded OOS returns were positive
- Assets’ quarterly WFE ratios of Sortinos averaged 65% above Pardo’s 0.5 threshold.
- Assets’ quarterly WFE ratios of means averaged 56% above the 0.5 threshold.
- Assets’ quarterly means averaged 76% positive.
- The % of quarters’ compounded returns that were above 2 standard deviations averaged at only 8% with little negative skew suggesting consistency of return size.
- Annualized Average quarterly compounded returns averaged at 10% with some positive skew.
- Total daily Max Drawdowns were bigger than most CAGRS, leaving 78% of MAR ratios’ (CAGR/MAX DD) under 1. 67% of max drawdowns were over 20% and those averaged at 35%.
- Total daily Profit Factors were close to 1.25 but still 78% of assets were under 1.25.
- Sugar and Palladium futures had some pretty wild positive return figures (double and triple digit CAGR, etc) but also some pretty outrageous skews suggesting concentration in performance measures’ range despite the rationale of being influenced by their extreme volatility.
Next stage, I entertained the idea of running a bootstrap test called White’s Reality Check to further test robustness of the PSAR.
