At the moment investment grade bonds with their low yields and risky exposure to interest rates are unattractive places to put your money. Broad equity indexes like the S&P 500 have higher potential gains and dividend yields in the 2% range, but the dramatic drawdowns of 2008/2009 are still fresh in our minds. Commodities like gold and oil look expensive—so where is a good place to put your money?
Below investment grade bond funds like SPDR’s JNK or iShares HYG are yielding in the 7% range. The interest rate risk of these “junk” bond ETFs is less than investment grade instruments because their yield is dominated by default risk rather than prevailing interest rates. If interest rates on highly rated bonds climb due to improved macro economics the non-investment grade yields stay relatively stable because corporate defaults decline during good economic times.
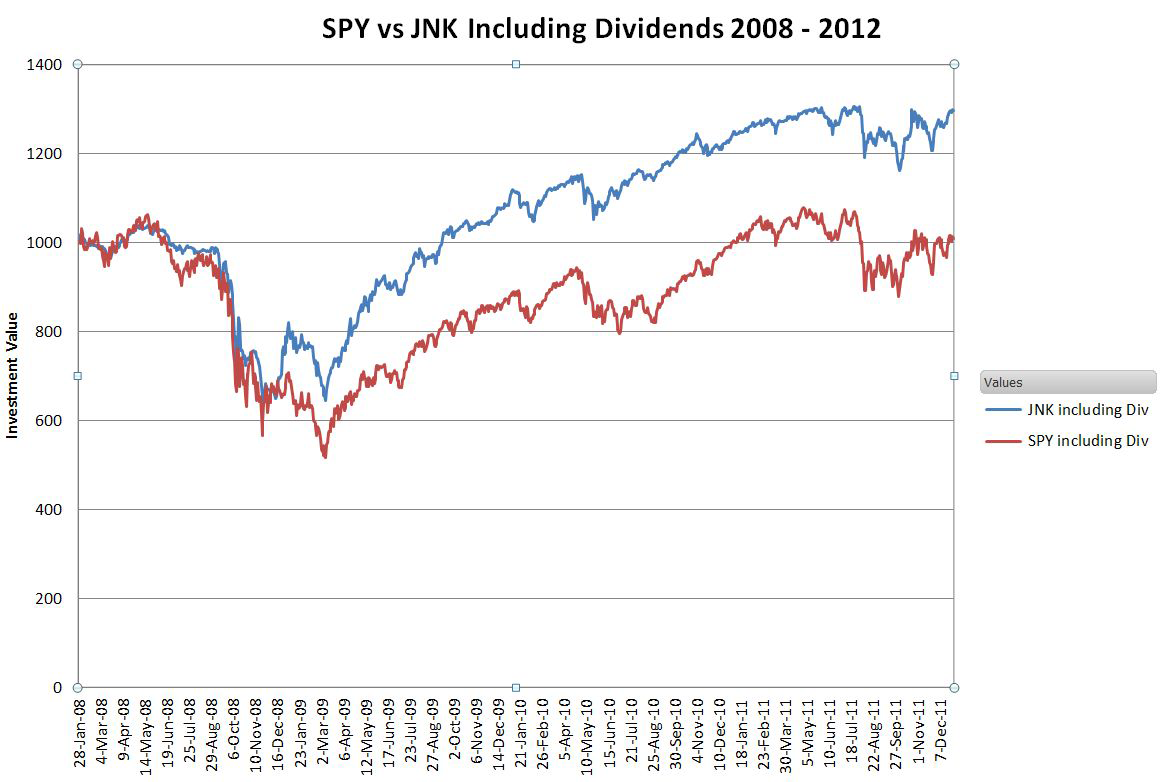
The prices of high yield ETFs tend to follow the general equity market because stocks prices are well correlated with the risks of corporations defaulting on their debt. The chart below shows the performance of $1000 invested in SPY (S&P 500) and JNK over the last few years.
During the 2008/2009 crash JNK bottomed out with a 38% decline. SPY declined 51%.
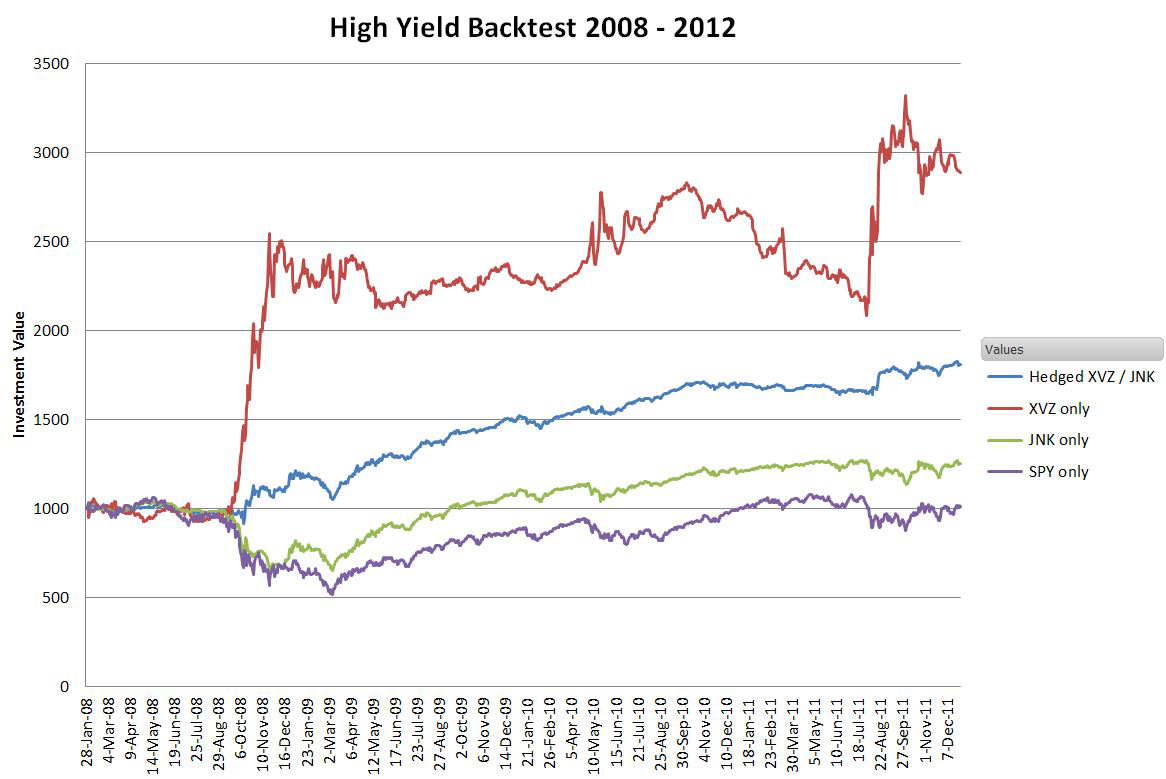
Volatility based tail risk funds like Barclays’ XVZ provide a way protect the principal of high yield bonds against severe market declines without giving up their interest rate advantages. For more information on XVZ see under the hood and backtest to 2004. The chart below shows the performance of $1000 invested in SPY, XVZ, JNK, and a hedged investment where 28% is put in XVZ and the rest in JNK. 
The respective compound annual growth numbers including dividends for this 4 year period were 2.6% (SPY), 28.5% (XVZ), 6.5% (JNK) , and 15.7% for the hedged approach.
You might ask, why not just put it all in XVZ? It had the best overall return, but the drawdowns (peak to trough) of 16% and 25% during the backtest time period would be hard for me to live with. The hedged portfolio on the other hand never dropped substantively below the starting level and its worst case drawdown was 9.2%. In the simulation I rebalanced the XVZ / JNK position quarterly and invested any accumulated dividends.
Risk factors include the fact that XVZ has only been trading since August of 2011, so its demonstrated track record is short. The high yield bond funds themselves are highly diversified, with JNK currently holding 227 different investments and HYG holding 504, but there are concerns that their current surge in popularity ($12 billion in inflows in the last 6 months), will result in increased risk and potential liquidity problems. That’s something I will be monitoring, but currently the overall sub-investment grade bond market is around $1 trillion, so the all the high yield ETFs together comprise less than 2% of that.
- English (UK)
- English (India)
- English (Canada)
- English (Australia)
- English (South Africa)
- English (Philippines)
- English (Nigeria)
- Deutsch
- Español (España)
- Español (México)
- Français
- Italiano
- Nederlands
- Português (Portugal)
- Polski
- Português (Brasil)
- Русский
- Türkçe
- العربية
- Ελληνικά
- Svenska
- Suomi
- עברית
- 日本語
- 한국어
- 简体中文
- 繁體中文
- Bahasa Indonesia
- Bahasa Melayu
- ไทย
- Tiếng Việt
- हिंदी
Protecting Junk Bond Principal With A Volatility Hedge
Published 04/26/2012, 01:56 AM
Updated 07/09/2023, 06:31 AM
Protecting Junk Bond Principal With A Volatility Hedge
Latest comments
Loading next article…
Install Our App
Risk Disclosure: Trading in financial instruments and/or cryptocurrencies involves high risks including the risk of losing some, or all, of your investment amount, and may not be suitable for all investors. Prices of cryptocurrencies are extremely volatile and may be affected by external factors such as financial, regulatory or political events. Trading on margin increases the financial risks.
Before deciding to trade in financial instrument or cryptocurrencies you should be fully informed of the risks and costs associated with trading the financial markets, carefully consider your investment objectives, level of experience, and risk appetite, and seek professional advice where needed.
Fusion Media would like to remind you that the data contained in this website is not necessarily real-time nor accurate. The data and prices on the website are not necessarily provided by any market or exchange, but may be provided by market makers, and so prices may not be accurate and may differ from the actual price at any given market, meaning prices are indicative and not appropriate for trading purposes. Fusion Media and any provider of the data contained in this website will not accept liability for any loss or damage as a result of your trading, or your reliance on the information contained within this website.
It is prohibited to use, store, reproduce, display, modify, transmit or distribute the data contained in this website without the explicit prior written permission of Fusion Media and/or the data provider. All intellectual property rights are reserved by the providers and/or the exchange providing the data contained in this website.
Fusion Media may be compensated by the advertisers that appear on the website, based on your interaction with the advertisements or advertisers.
© 2007-2025 - Fusion Media Limited. All Rights Reserved.
