
Have you been eager to see how Prologis Inc.’s (NYSE:PLD) performed in Q2 in comparison with the market expectations? Let’s quickly scan through the key facts from this San Francisco, CA – based industrial real estate investment trust’s (REIT) earnings release this morning:
A FFO Beat
Prologis came out with core funds from operations ("FFO") per share of 84 cents, beating the Zacks Consensus Estimate of 78 cents.
Better-than-expected growth in revenues was primarily responsible for this beat.
How Was the Earnings Surprise Trend?
Prologis has a decent earnings surprise history. Before posting a beat in Q2, the company delivered positive surprise in three out of prior four quarters and in-line results in the other occasion, as shown in the chart below.
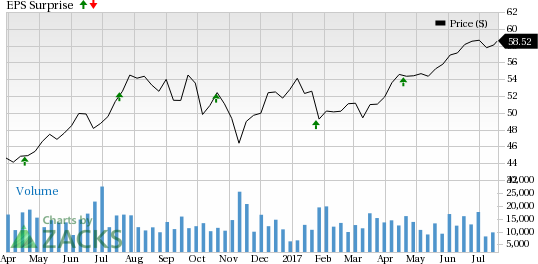
Overall, the company surpassed the Zacks Consensus Estimate by an average of 1.90% in the trailing four quarters.
Revenue Came Higher Than Expected
Prologis posted revenues of $766.2 million, which beat the Zacks Consensus Estimate of $658.7 million. It compared favorably with the year-ago number of $602.2 million.
Key Developments to Note:
Prologis raised core FFO per share outlook for full-year 2017. The company now projects core FFO per share in the range of $2.78–$2.82, up from $2.72–$2.78 guided earlier, reflecting an increase of 5 cents at the midpoint.
It anticipates net effective same store net operating income (NOI) (Prologis share) to grow at 4.75–5.25% compared to the previous outlook of 4.50–5.25%.
What Zacks Rank Says
Prologis currently has a Zacks Rank #2 (Buy). However, since the latest earnings performance is yet to be reflected in the estimate revisions, the rank is subject to change. While things apparently look favorable, it all depends on what sense the just-released report makes to the analysts.
(You can see the complete list of today’s Zacks #1 Rank (Strong Buy) stocks here.)
Note: All EPS numbers presented in this write up represent funds from operations (“FFO”) per share. FFO, a widely used metric to gauge the performance of REITs, is obtained after adding depreciation and amortization and other non-cash expenses to net income.
Check back later for our full write up on this PLD earnings report later!
5 Trades Could Profit "Big-League" from Trump Policies
If the stocks above spark your interest, wait until you look into companies primed to make substantial gains from Washington's changing course.
Today Zacks reveals 5 tickers that could benefit from new trends like streamlined drug approvals, tariffs, lower taxes, higher interest rates, and spending surges in defense and infrastructure. See these buy recommendations now >>
ProLogis, Inc. (PLD): Free Stock Analysis Report
Original post