
Shares of Progressive Corp.’s (NYSE:PGR) gained 1.83% in the trading session after the company posted improved results for the month of May. Operating earnings per share of 12 cents increased by a cent on a year-over-year basis on lower expenses. Including net realized gains, net income per share grew 8% year over year to 14 cents.
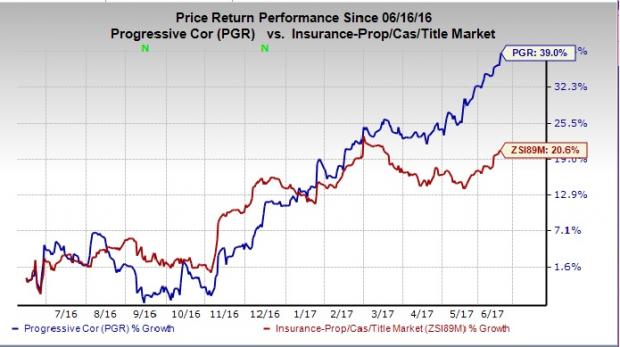
Year to date, Progressive’s shares have surged 25.1%, outperforming the Property and Casualty Insurance industry’s 5.5% increase. This share price appreciation was driven by the company’s sustained strong results.
Numbers in May
Progressive recorded net premiums written of $2.0 billion in May 2017 was up 15% from $1.7 billion in the year-ago month. Net premiums earned were about $1.9 billion, up 14% year over year from $1.7 billion.
Net realized gains on securities in the month were $17.2 million flat year over year. Combined ratio − the percentage of premiums paid out as claims and expenses – deteriorated 60 basis points (bps) from the prior-year quarter to 96.4%.
Total operating revenue came in at $2.0 billion. The top line declined 7% year over year due to a 7% decrease in premiums, and 15% higher fees and other revenues. However, there has been a 36% rise in investment income and 1% rise in service revenues.
Total expenses augmented 14.7% to $1.9 billion. The rise in expenses can be primarily attributed to 15.6% higher losses and loss adjustment expenses, 13.9% rise in policy acquisition costs and 10% higher other underwriting expenses.
In May 2017, policies in force were impressive with the Personal Auto segment improving 8% year over year to nearly 11 million. Special Lines increased 2% from the prior-year month to 4.3 million.
In Progressive’s Personal Auto segment, Direct Auto and Agency Auto climbed 8% each to 5.3 million and 5.7 million, respectively.
Progressive’s Commercial Auto segment grew 5% year over year to 0.6 million. The Property business had about 1.3 million policies in force in the reported month, up 20% year over year.
Progressive’s book value per share was $15.35 as of May 31, 2017, up 15.7% from $13.27 as of May 31, 2016.
Return on equity on a trailing 12-month basis was 19.6%, up 650 bps from 13.1% in May 2016. Debt-to-total capital ratio too deteriorated 480 bps year over year to 30.7% as of May 31, 2017.
Zacks Rank and Other Insurers
Progressive carries a Zacks Rank #3 (Hold). Some better-ranked property and casualty (P&C) insurers are American Financial Group, Inc. (NYSE:AFG) , CNA Financial Corporation (NYSE:CNA) and Fidelity National Financial, Inc. (NYSE:FNF) .
American Financial Group primarily engages in P&C insurance with a focus on specialized commercial products for businesses. The company delivered positive earnings surprise in three of the last four quarters with an average beat of 11.47%. The company carries a Zacks Rank #2 (Buy). You can see the complete list of today’s Zacks #1 Rank (Strong Buy) stocks here.
CNA Financial offers commercial P&C insurance products primarily in the U.S. The company delivered positive surprises in three of the last four quarters with an average beat of 12.45%. The company carries a Zacks Rank #2.
Fidelity National provides title insurance, plus technology and transaction services to the real estate and mortgage industries in the U.S. The company delivered positive surprises in three of the last four quarters with an average beat of 8.47%. The company holds a Zacks Rank #2.
3 Stocks to Ride a 588% Revenue Explosion
At Zacks, we're mostly focused on short-term profit cycles, but the hottest of all technology mega-trends is starting to take hold...
By last year, it was already generating $8 billion in global revenues. By 2020, it's predicted to blast through the roof to $47 billion. Famed investor Mark Cuban says it will produce "the world's first trillionaires," but that should still leave plenty of money for those who make the right trades early. See Zacks' Top 3 Stocks to Ride This Space >>
Progressive Corporation (The) (PGR): Free Stock Analysis Report
CNA Financial Corporation (CNA): Free Stock Analysis Report
Fidelity National Financial, Inc. (FNF): Free Stock Analysis Report
American Financial Group, Inc. (AFG): Free Stock Analysis Report
Original post
Zacks Investment Research