There is a demand for profit-taking in the markets after powerful movements at the end of last week and a very aggressive trading start of the week. On Monday afternoon there was a cautious demand for some risky assets, as investors considered the recent sell-off as gone too far. However, investors should be cautions. The key problems that have caused pressure in the markets are still unresolved, which means that a new wave of flight from risks is likely to be in the near future.

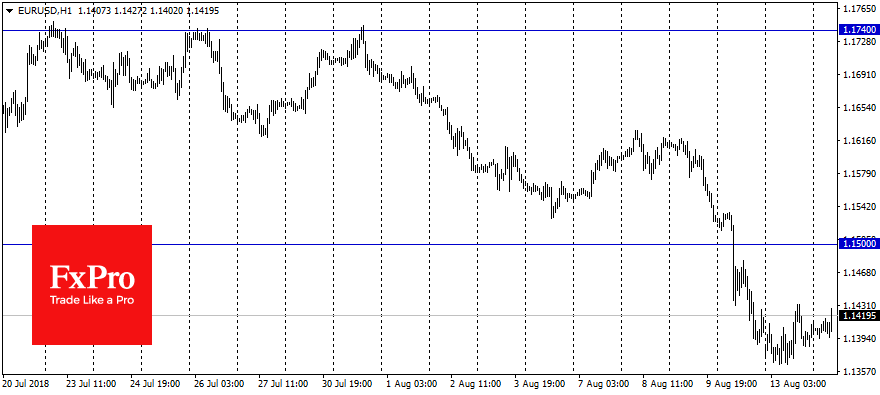
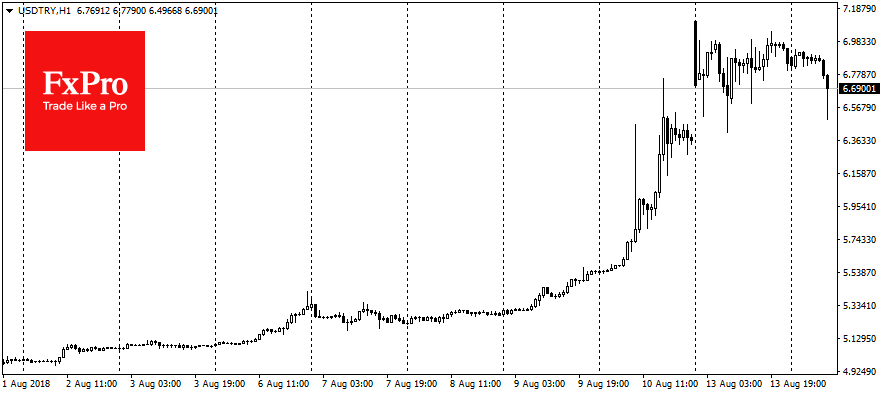
EUR/USD is trading near the closing levels of Friday in the area of 1.1400 after the fall at the start of Monday down to 1.1360. The South African rand (ZAR) has almost completely recovered its losses after a sliding by 10% early in the day on Monday. The Turkish lira has stabilized near 6.9 per dollar after the country’s central bank had announced the measures to maintain liquidity. This morning the course remains near yesterday’s levels and thus allows hoping for some respite in updating the historical highs. The interventions of the Central Bank of India and Indonesia played its calming role for the Emerging Markets.

It may also be expected that EM countries will increase their rates in order to protect against capital outflows, despite the risks of economic slowdown.
And yet it should be noted that the risks of further tension growth remain possible in the markets. The key problems remain unresolved: the diplomatic conflict between the United States and Turkey does not wane, with Erdogan’s statements on Friday only having added fuel to the fire. The trade dispute between the USA and China has not led anywhere yet, and the latest data has already indicated the slowdown of the 2nd world economy as a result of the earlier imposed sanctions.
Markets can get a respite from the rally today or for a few days at best, but the worst is still ahead as we could see the sale-off on stock and bonds markets, which often happens with some lag after the speculative currency moves.
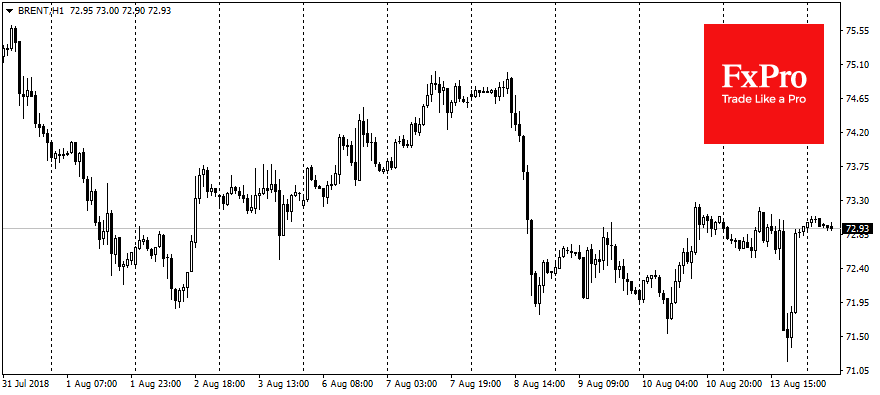
On the commodity markets, there also were some big movements on Monday. OPEC’s forecast update caused oil to collapse by more than 2% to $71.17 per barrel of Brent crude, the lowest rate since April this year. The reason was the decreased expectations of the demand growth and the estimation, that the countries outside OPEC increase production faster than the demand grows. The issue of oil supply surplus is becoming relevant once again. This is bad news for OPEC, whose market share has declined in recent years from the usual 40% to 32%, and the stabilization of supply requires even bigger reduction. Just one month after the increase in quotes, it looks unlikely that the cartel would lower them once again.

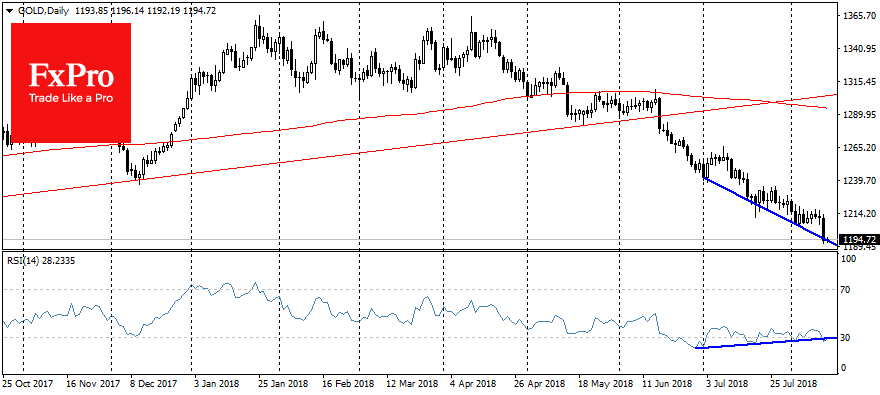
Gold fell below the $1200 per ounce against the backdrop of the weakening of currencies, which are ones of the main precious metal consumers (China, India, Turkey). Nevertheless, the prospects of further gold weakening look limited. For developing countries, gold can be a good politically neutral means of saving capital before the threat of increasing inflation.

Alexander Kuptsikevich, the FxPro Analyst
