So it happened - oil reversed lower and we were right there. While yesterday's downswing has been partially retraced, and oil is trading close to unchanged today, there're still plenty of valuable clues as to the upcoming price action. Let's dive in to see how they reflect on our profitable decision.
We'll take a closer look at the charts below (charts courtesy of stockcharts.com and stooq.com ).

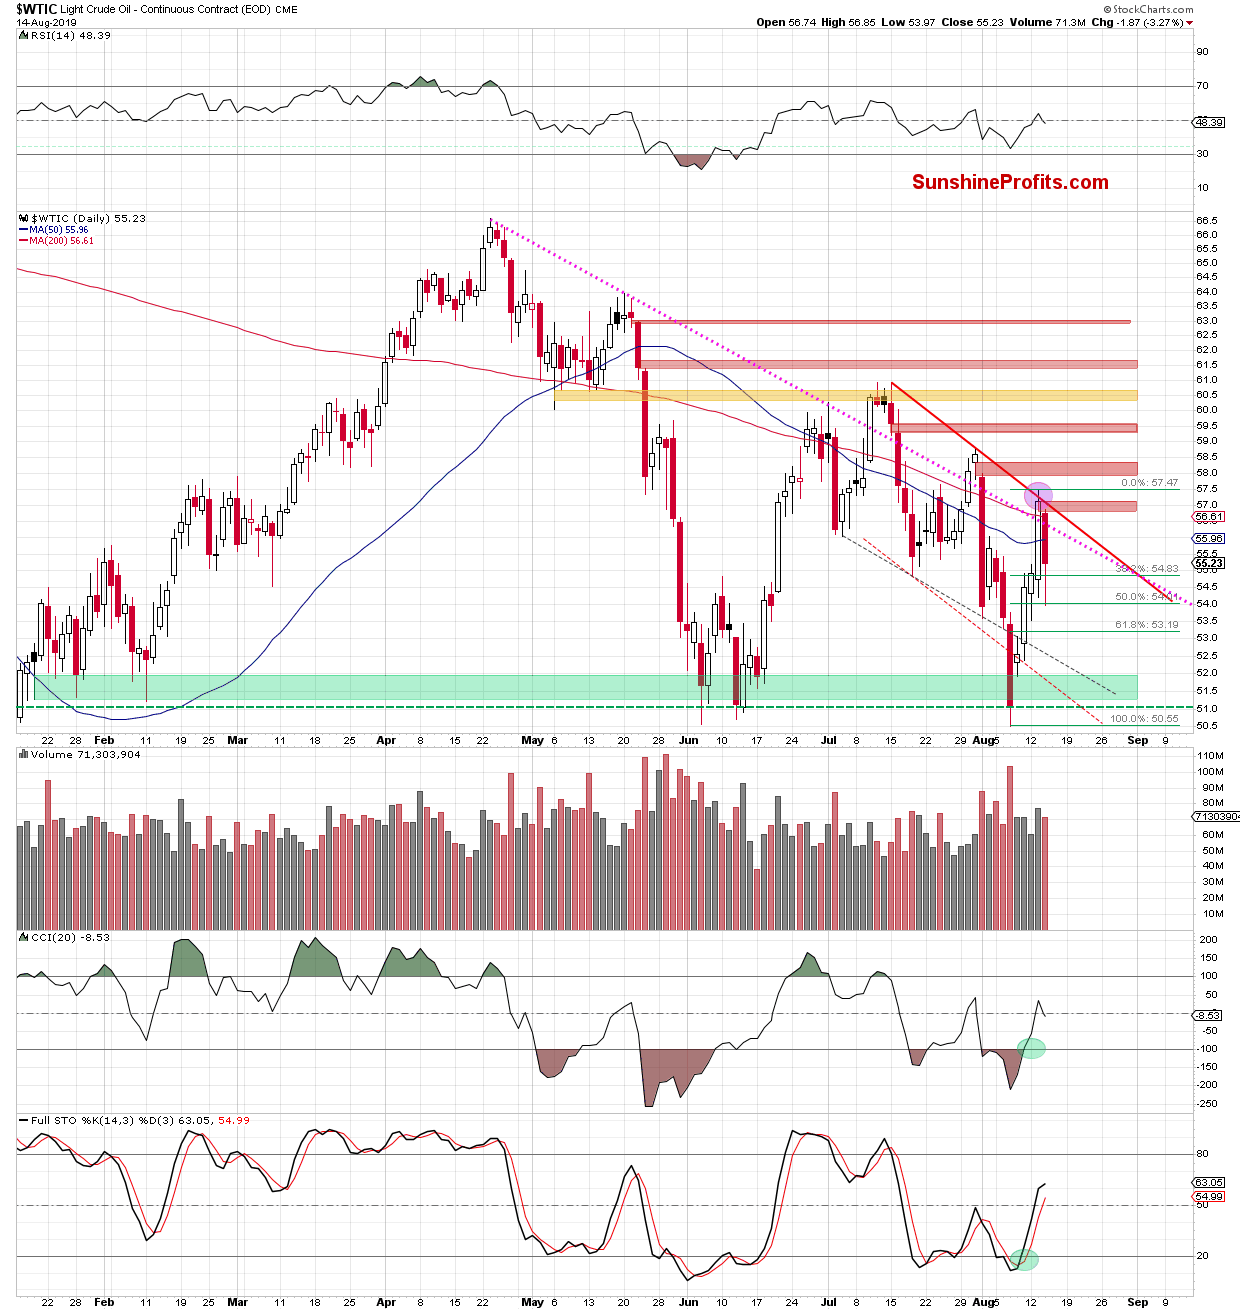
Tuesday's invalidation of the tiny breakout above the declining red resistance line hinted at buyers' weakness, preceding Wednesday's slide. That day, crude oil opened with the red gap - while the bulls partially closed it, they hadn't been fully successful.
The bears took the reins since, and oil has tested the 50% Fibonacci retracement. This support triggered a rebound and the commodity erased some of earlier losses, but still closed the day below the pink dotted resistance line. This is similar to the price action we have seen two times in the past: on July 16 and then on August 1. In both cases, such development translated into further deterioration in the following days.
Let's not forget that oil has moved below the 50-day moving average. In fairness though, the volume of yesterday's downswing could have been bigger - that would lend it even more weight.
Let's check today's action in the oil futures for more clues.

Let's quote from our commentary:
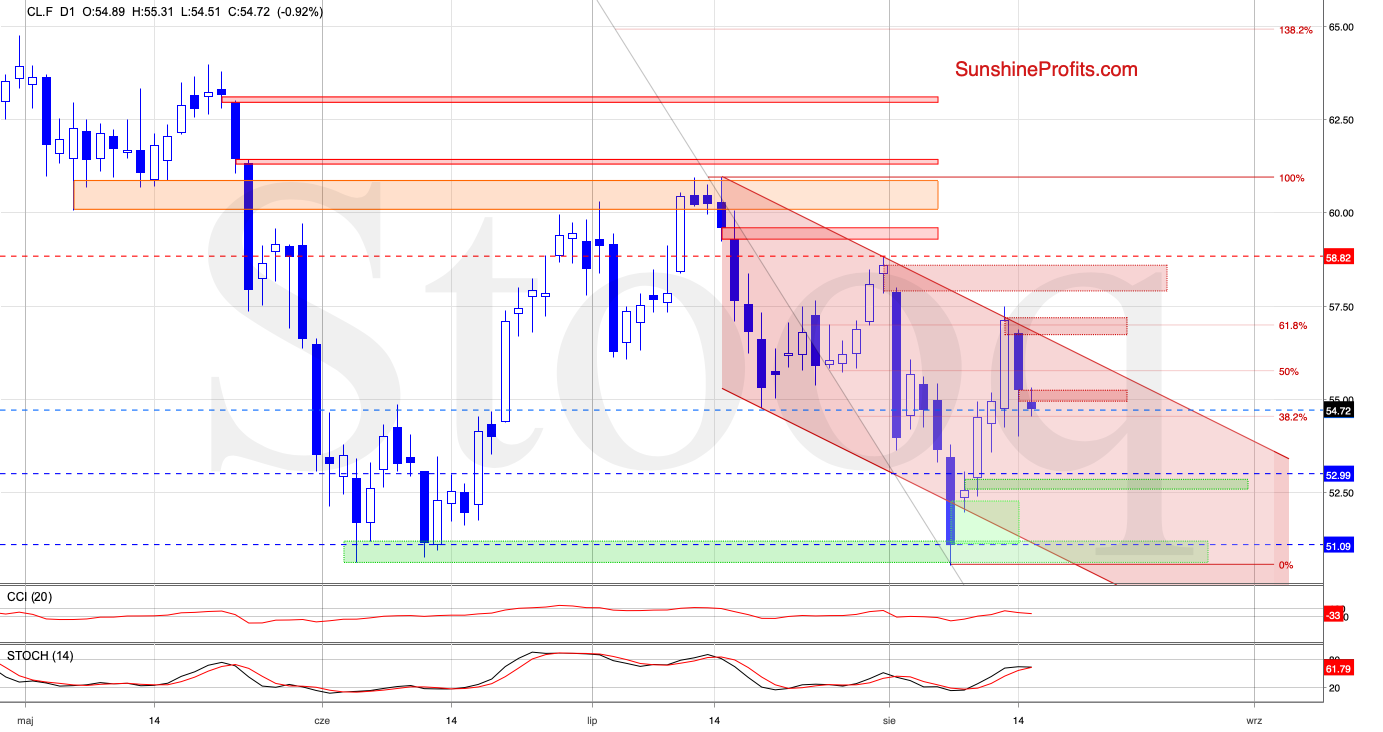
(...) the 61.8% Fibonacci retracement in combination with the upper border of the channel encouraged the sellers to act, resulting in a pullback before the day's close.
As a result, the futures finished Tuesday back inside the channel, invalidating the earlier tiny breakout. This sign of weakness encouraged the bears to act earlier today, resulting in a daily opening with the red gap. (...)
We have seen a similar price action on August 1 already - and it translated into a sharp move to the downside. Taking this fact into account and combining it with the above-mentioned resistances, opening short positions is justified from the risk/reward perspective. (...)
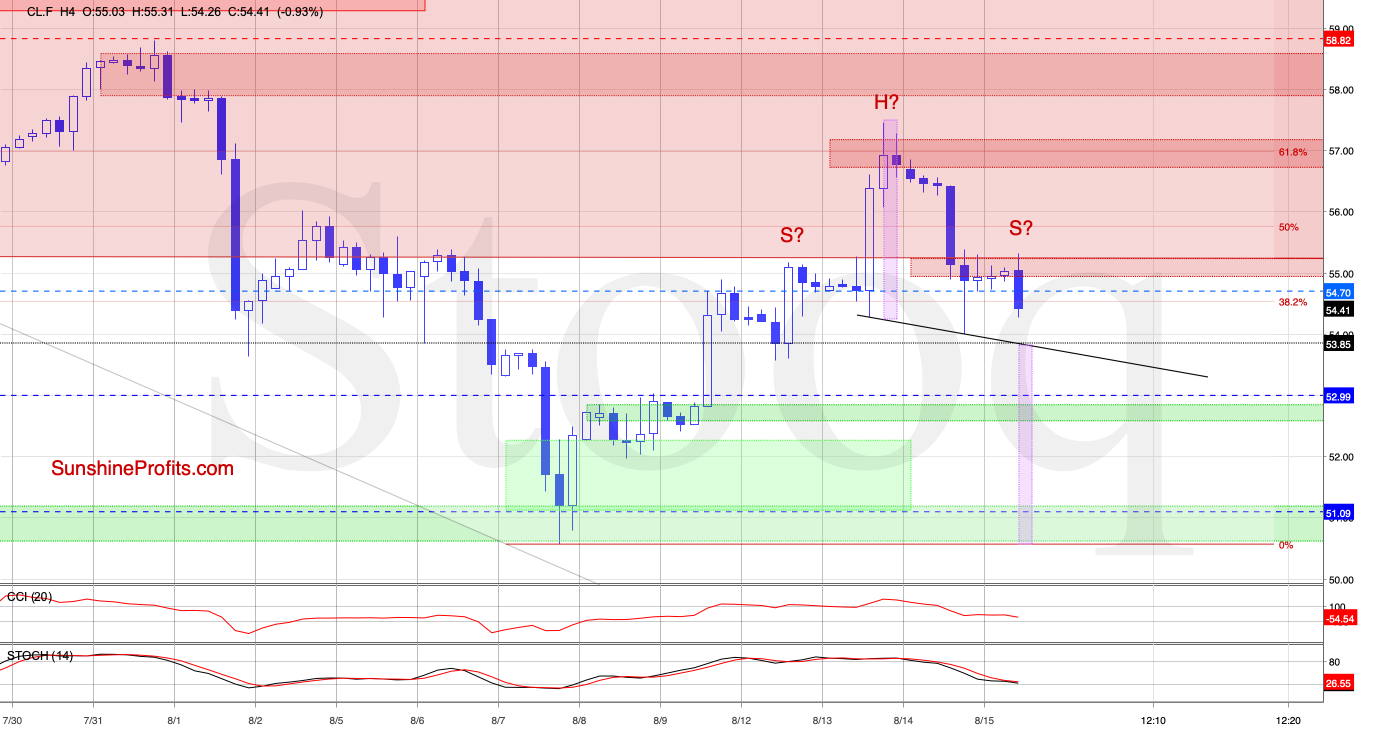
The daily chart shows that crude oil futures extended loses after the Alert was posted, which resulted in a drop to our initial downside target. Although the futures rebounded before yesterday's closing bell, they opened today with another red gap, which doesn't bode well for the bulls - especially when we factor in the 4-hour chart below.

We see that the recent price action looks like a potential head and shoulders formation. If this is the case, the futures are in the process of creation of the right arm of the formation. The would-be formation will bring implications only if the price drops below the neckline (that's the black support line based on recent lows - currently at around $53.85).
Should the sellers power below with strength, crude oil futures could visit even the early-August lows and the green support zone based on them. In this area, the size of the downward move would correspond to the height of the preceding formation (as seen marked with purple rectangles).
Connecting the dots, our already profitable short position remains justified from the risk/reward perspective.
Summing up, oil went on a powerful downswing yesterday, piercing through important supports. While it happened on significant volume, a higher reading would give it more credence. Earlier today, the bears opened with another gap lending further support to the sellers. Additionally on the 4-hour chart, we see a potential head-and-shoulders formation in the making - once completed, that would represent another bearish factor. The profitable short position remains justified.
