Stock market today: S&P 500 climbs as ongoing AI-led rebound pushes tech higher
The holy grail of portfolio design is combining assets so that returns are relatively stable if not higher, risk is generally lower and the overall mix delivers stronger risk-adjusted performance that’s not otherwise available through owning the components separately. Diversification, as the saying goes, is the only free lunch in investing.
The practical realities, of course, are messy and and not always satisfying. Replicating textbook results, in short, is challenging. But there’s enough real-world opportunity available to warrant prioritizing this facet of money management. The standard approach is to review correlation data for assets—a task that periodically shows up on pages of The Capital Spectator for the major asset classes.
Reviewing return correlations is useful but it’s hardly a silver bullet, which inspires looking to other metrics for additional insigh—cointegration—for example, which is a methodology for evaluating the prospects for mean reversion for a pair of assets.
Mark Rzepczynski at the Disciplined Systematic Global Macro Views blog highlights another possibility: principal component analysis (PCA), “a data dimensionality reduction tool” that “looks for similarity across data or common feature extraction,” he explains in a recent post. “By eliminating common features, we can find uniqueness. By grouping common features, we can find clusters which can be graphically displayed.”
When assets cluster around common factors or have similar covariance characteristics, asset allocation becomes more difficult. One, there is less diversification benefit. A cluster of assets around principal components will not offer any benefit to investors. Portfolio risk is not diminished. Two, the covariance matrix becomes less stable and optimization becomes harder. The asset allocation will become sensitive to small changes in the price behavior of any asset in the portfolio.
Inspired by Rzepczynski’s post, let’s review how the major asset classes stack up through a PCA lens in recent history. We’ll use our standard ETF proxies for the data. But first, a quick summary of PCA, which isn’t the most intuitive metric in the portfolio designer’s toolkit.
In Chapter 5 (“Factor Analysis”) in my book Quantitative Investment Portfolio Analytics In R: An Introduction To R For Modeling Portfolio Risk and Return I lay out a simple coding example for calculating PCA analytics, which are used below to generate the results. In the book I explain that PCA is essentially a tool for estimating betas in a portfolio setting. These betas are unnamed since they’re derived statistically, although most analysts consider the first PCA (PC1) as the “market beta.” Accordingly, PC1 is the dominant risk factor driving results, PC2 is the second-biggest influence, PC3 the third, and so on.
It’s also important to recognize that PCAs are orthogonal, which is to say that they’re independent of each other (uncorrelated) and so they represent relatively pure statistical risk-factor buckets—buckets that aren’t always obvious (or accessible) through other means. Building portfolios based on PCAs is, as a result, can be a powerful strategy unto itself, but that’s a subject for another day.
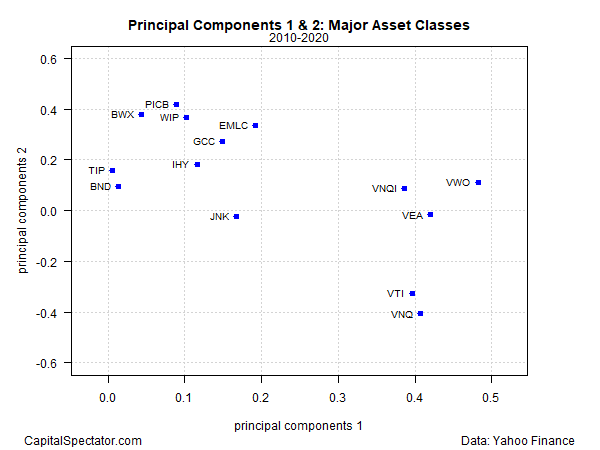
Rzepczynski focuses on comparing PC1 and PC2 for evaluating the level of diversification power (or the lack thereof) for a given set of assets. Here’s how the ETF proxies for the major asset classes stack up based on daily returns for the trailing 10-year window through yesterday (Oct. 7):

The graph suggests there are two main clusters (or perhaps three or even four, but for now we’ll assume two). On the right side are equities, including US stocks (VTI), foreign shares in developed markets (VEA) and emerging markets stocks (VWO). US real estate investment trusts (VNQ) and foreign property shares (VNQI) are also part of the cluster.
The other main cluster in the upper left-hand quadrant represents the primary risk sources for diversifying stocks and real estate shares. Not surprisingly, the upper left-hand cluster includes various flavors of bonds, including a broad measure of US investment-grade fixed income (BND). This quadrant also includes commodities (GCC), US junk bonds (JNK) and bonds issues by governments in emerging markets (EMLC).
PCA-based analysis is subject to a particular set of caveats and limitations, as is every econometric modeling application. But at the very least it’s a handy tool for double-checking assumptions about diversification via correlation and other techniques. For example, the chart above suggests that there’s considerably less diversification benefits between US stocks (VTI) and US REITs (VNQ) than widely assumed. One run of the numbers is hardly the last word on this topic, but if PCA spurs deeper analysis and a thoughtful review the tool has already proven its worth.
