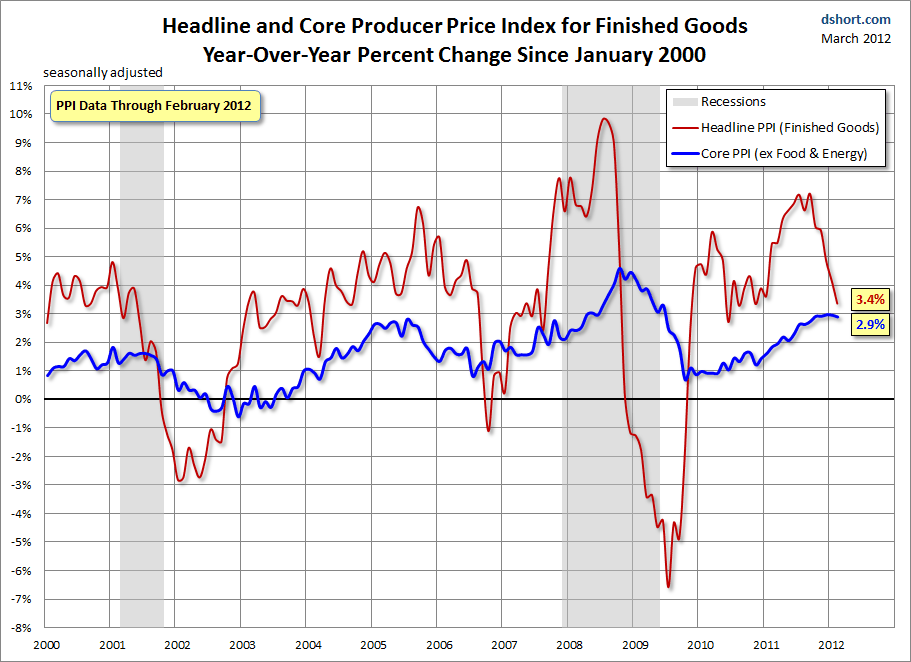
Today's release of the Producer Price Index (PPI) for February shows the largest month-over-month increase since September. The seasonally adjusted finished goods number was up 0.4% MoM and 3.4% year-over-year, the latter being a decline from last month's 4.1%. The interim YoY high was 7.2% in September of last year. Core PPI (ex food and energy) moderated a bit at 0.2% MoM, down from last month's 0.4%. The YoY 2.9% was fractionally lower than last month's 3.0%. Briefing.com had posted a MoM consensus forecast of 0.5% for Headline PPI and 0.2% for Core PPI. Here are a couple of snippets from the news release: Finished energy: Prices for finished energy goods advanced 1.3 percent in February after declining in each of the previous two months. A 4.3-percent jump in the gasoline index accounted for most of the increase. Advances in the indexes for residential electric power and home heating oil also contributed to the rise in finished energy goods prices. (See table 2.)
Finished core: The index for finished goods less foods and energy moved up 0.2 percent in February, the third straight monthly increase. A third of the February rise can be traced to a 0.6-percent advance in prices for pharmaceutical preparations. An increase in the index for civilian aircraft also contributed to higher finished core prices.
Finished foods: In February, the finished consumer foods index inched down 0.1 percent, the third consecutive monthly decrease. A 2.8-percent drop in prices for dairy products led the February decline in the finished consumer foods index More...
Now let's visualize the numbers with an overlay of the Headline and Core (ex food and energy) PPI for finished goods since 2000, seasonally adjusted. As we can see, Core PPI declined significantly during 2009 and increased modestly in 2010. The rate of increase moved higher in 2011.
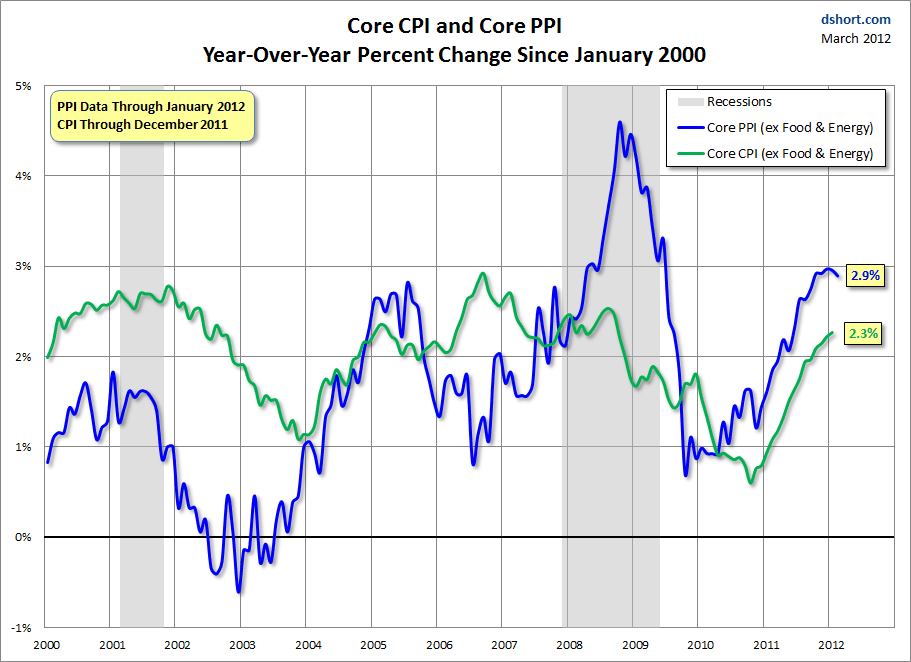
As the next chart shows, the Core Producer Price Index is more volatile than the Core Consumer Price Index. For example, during the last recession producers were unable to pass cost increases to the consumer. Likewise in 2010 the Core PPI generally rose while Core CPI generally fell. But over the past year these two core metrics have been moving in tandem.
Tomorrow will bring us the more widely followed CPI inflation indicator.
- English (UK)
- English (India)
- English (Canada)
- English (Australia)
- English (South Africa)
- English (Philippines)
- English (Nigeria)
- Deutsch
- Español (España)
- Español (México)
- Français
- Italiano
- Nederlands
- Português (Portugal)
- Polski
- Português (Brasil)
- Русский
- Türkçe
- العربية
- Ελληνικά
- Svenska
- Suomi
- עברית
- 日本語
- 한국어
- 简体中文
- 繁體中文
- Bahasa Indonesia
- Bahasa Melayu
- ไทย
- Tiếng Việt
- हिंदी
Producer Price Index: Energy Prices Boost Headline Inflation
Published 03/15/2012, 11:48 AM
Updated 07/09/2023, 06:31 AM
Producer Price Index: Energy Prices Boost Headline Inflation
Latest comments
Loading next article…
Install Our App
Risk Disclosure: Trading in financial instruments and/or cryptocurrencies involves high risks including the risk of losing some, or all, of your investment amount, and may not be suitable for all investors. Prices of cryptocurrencies are extremely volatile and may be affected by external factors such as financial, regulatory or political events. Trading on margin increases the financial risks.
Before deciding to trade in financial instrument or cryptocurrencies you should be fully informed of the risks and costs associated with trading the financial markets, carefully consider your investment objectives, level of experience, and risk appetite, and seek professional advice where needed.
Fusion Media would like to remind you that the data contained in this website is not necessarily real-time nor accurate. The data and prices on the website are not necessarily provided by any market or exchange, but may be provided by market makers, and so prices may not be accurate and may differ from the actual price at any given market, meaning prices are indicative and not appropriate for trading purposes. Fusion Media and any provider of the data contained in this website will not accept liability for any loss or damage as a result of your trading, or your reliance on the information contained within this website.
It is prohibited to use, store, reproduce, display, modify, transmit or distribute the data contained in this website without the explicit prior written permission of Fusion Media and/or the data provider. All intellectual property rights are reserved by the providers and/or the exchange providing the data contained in this website.
Fusion Media may be compensated by the advertisers that appear on the website, based on your interaction with the advertisements or advertisers.
© 2007-2025 - Fusion Media Limited. All Rights Reserved.
