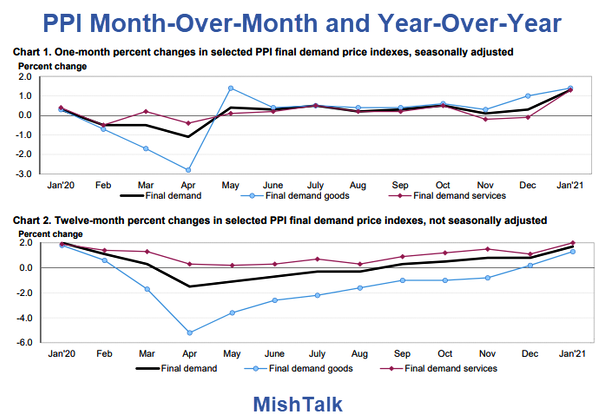
Economists expected the PPI to increase by 0.4 percent. They were not close.

PPI Final Demand vs Expectations
- Month-Over-Month: Expected 0.4% Actual 1.3%
- MOM Excluding Food and Energy: Expected 0.2% Actual 1.2%
- MOM Excluding Food, Energy, Trade Services: Expected 0.2% Actual 1.2%
- Year-Over-Year: Expected 0.9% Actual1.7%
- YOY Excluding Food and Energy: Expected 1.2% Actual 2.0%
That's a pretty bad set of misses courtesy of Econoday with PPI Report Numbers from the Bureau of Labor Statistics (BLS).

PPI Details
- The Producer Price Index for final demand increased 1.3 percent in January. This advance is the largest since the index began in December 2009.
- Final demand prices rose 0.3 percent in December and 0.1 percent in November.
- On an unadjusted basis, the index for final demand moved up 1.7 percent for the 12 months ended January 2021, the largest increase since climbing 2.0 percent for the 12 months ended January 2020.
- Two-thirds of the January advance in prices for final demand can be traced to a 1.3-percent rise in the index for final demand services.
- Prices for final demand goods increased 1.4 percent.
- Prices for final demand less foods, energy, and trade services moved up 1.2 percent in January, the largest advance since the index began in September 2013.
- For the 12 months ended in January, prices for final demand less foods, energy, and trade services rose 2.0 percent, the largest increase since a 2.1 percent advance for the 12 months ended June 2019.
Final Demands Services
- Prices for final demand services rose 1.3 percent in January, the largest advance since the index began in December 2009.
- Over 70 percent of the broad-based January increase is attributable to a 1.4-percent jump in prices for final demand services less trade, transportation, and warehousing.
- The indexes for final demand trade services and for final demand transportation and warehousing services also moved higher, 1.0 percent and 1.3 percent, respectively. (Trade indexes measure changes in margins received by wholesalers and retailers.)
- One-fourth of the January advance in the index for final demand services can be traced to a 9.4-percent rise in prices for portfolio management.
- The indexes for outpatient care (partial); guestroom rental; machinery and vehicle wholesaling; apparel, jewelry, footwear, and accessories retailing; and truck transportation of freight also moved higher.
- Margins for automobile retailing (partial) fell 7.7 percent. The indexes for food retailing and for property and casualty insurance also declined.
Final Demand Goods
- Prices for final demand goods moved up 1.4 percent in January, the largest increase since the index jumped 1.4 percent in May 2020.
- Nearly 60 percent of the broad-based January advance is attributable to a 5.1 percent rise in prices for final demand energy.
- The indexes for final demand goods less foods and energy and for final demand foods also climbed, 0.8 percent and 0.2 percent, respectively.
- Forty percent of the January increase in prices for final demand goods can be traced to a 13.6-percent jump in the index for gasoline.
- Prices for iron and steel scrap, oilseeds, industrial chemicals, diesel fuel, and light motor trucks also rose.
- The index for beef and veal declined 8.4 percent.
- Prices for fresh and dry vegetables and for search, detection, navigation, and guidance systems and equipment also fell.
