
The lower the price paid the higher the return. This is a simple truth all stock market investors should keep in mind all the time. Yet, few really do. Procter & Gamble Company (NYSE:PG), for example, is the same strong company it was last year and the year before.
Depending on the price you paid for its stock, however, it could have brought you tremendously different returns. Procter & Gamble stock was hovering near $95 a share in September, 2017. Investors, who paid that price 16 months ago are just breaking even now.
But those, who joined the bulls near $71 in early May 2018, have earned a good 35% interest on their money in less than a year.
Procter & Gamble 20-Year Channel
Now, with PG stock approaching $97, it is time to take a look at the charts and see if it is still a good bet at the current price.
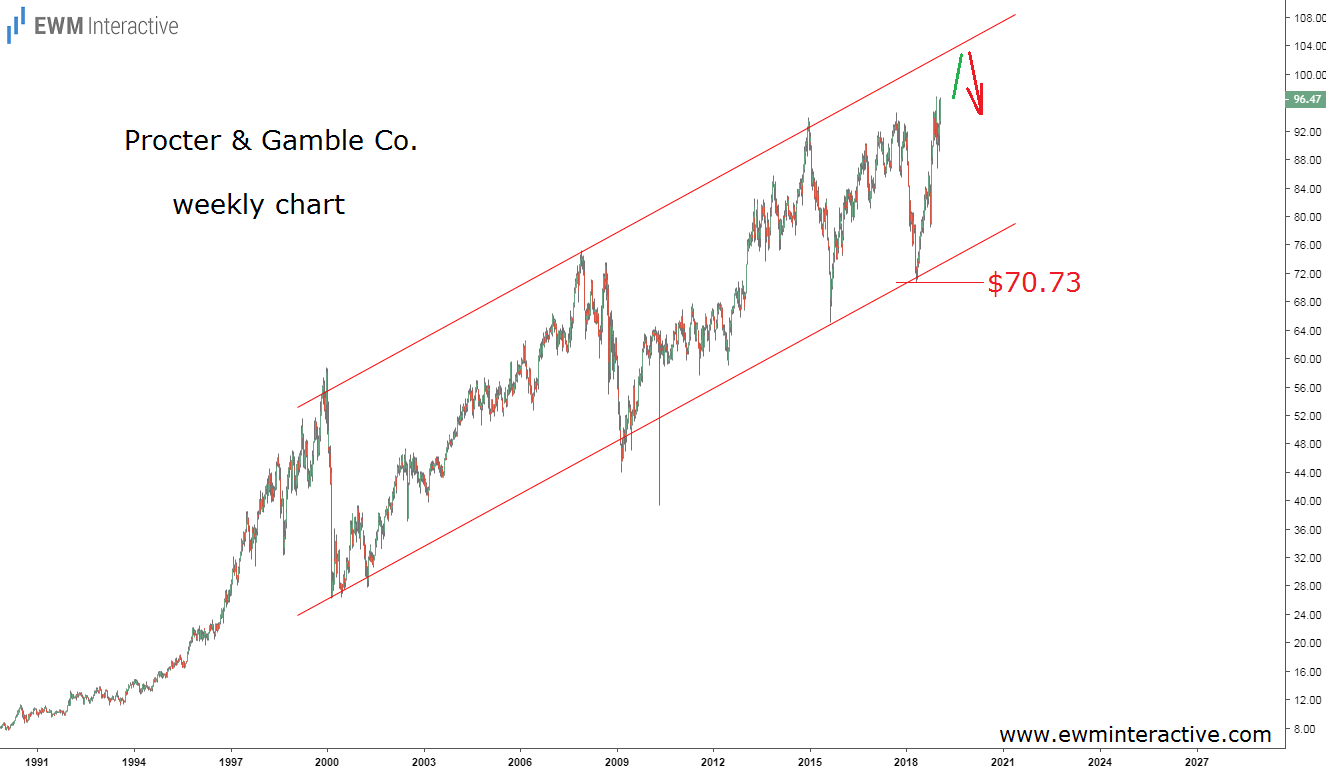
The weekly price chart of the stock shows PG has been moving within the parallel lines of a channel for the past 20 years. The upper line of the channel served as resistance in 1999, 2007 and 2014. The share price bounced off the lower line in 2000, 2009, 2015 and most recently in May 2018.
Unfortunately for the bulls, Procter & Gamble is approaching the upper line of this huge channel once again, so it makes sense to prepare for another bearish reversal. Of course, we cannot rely on a single line for our analysis. The Elliott Wave principle applied to the 4-hour chart of PG stock below will add another layer of conviction.
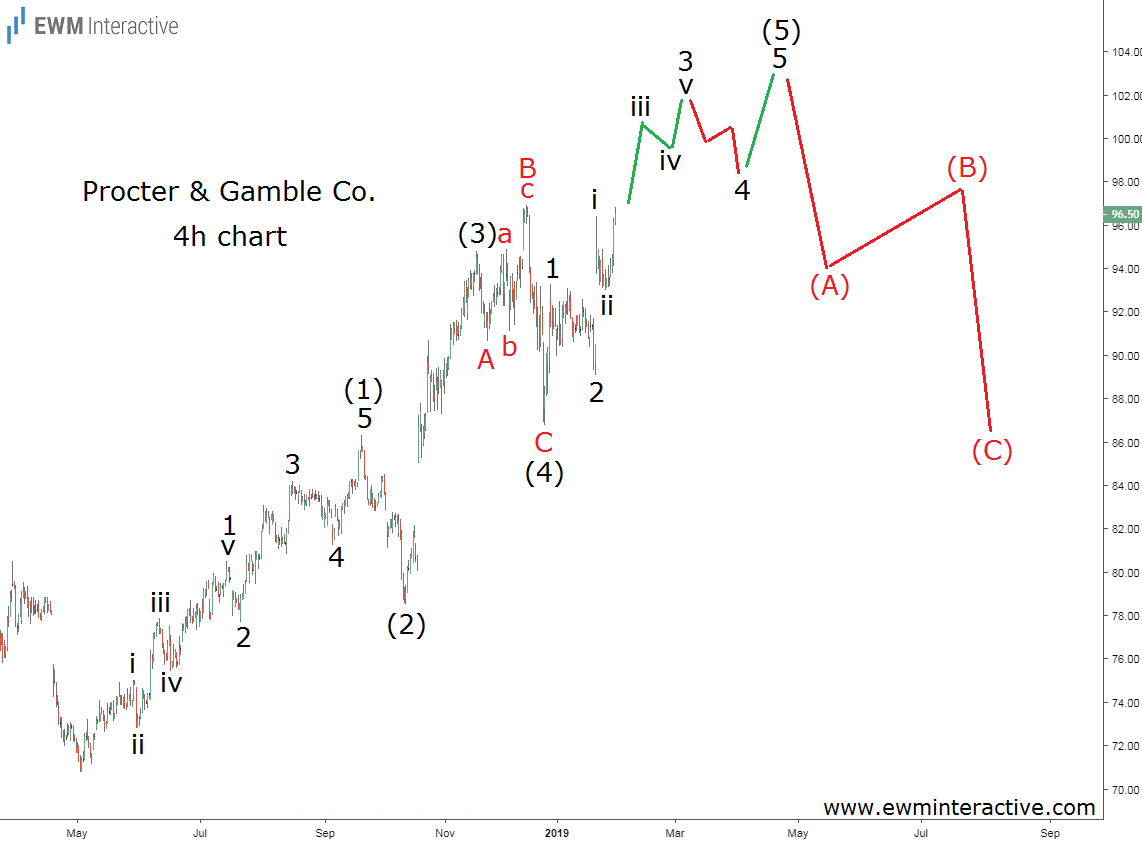
The 4-hour chart of Procter & Gamble visualizes the rally from $70.73 for us. As shown, it has evolved into a five-wave impulse pattern, whose wave (5) is still in progress.
The sub-waves of wave (1) are perfectly visible, as well. The market has also obeyed the guideline of alternation since wave (2) is a sharp pullback, while wave (4) is a sideways correction in the form of an A-B-C expanding flat.
Major Resistance Approaching
The Elliott Wave theory states that a three-wave correction follows every impulse. If this count is correct, wave (5) is about to lift Procter & Gamble stock to a new all-time high near $105 before the bears show up. This price level coincides with the upper line of the price channel on the weekly chart, which further supports the bearish idea.
The bulls might enjoy a few more months of gains, but both the weekly and 4-hour charts indicate the rally from $70.73 is slowly coming to an end. In the next couple of years Procter & Gamble longs opened at the current price levels are likely to yield returns no different than of those opened in September 2017.
There is a difference between a good company and a good investment. Procter & Gamble is undoubtedly a great company, but it cannot grow fast enough to justify the high price of the stock, which makes it a bad investment right now.