
The Procter & Gamble Company (NYSE:PG) , popularly known as P&G, reported second-quarter fiscal 2018 financial results, wherein both earnings and revenues surpassed expectations. The company has also lifted its core earnings per share guidance to reflect the potential benefit from the Tax Act.
P&G’s fiscal second-quarter core earnings of $1.19 per share beat the Zacks Consensus Estimate of $1.15 by 3.5%. The bottom line increased 10% from the prior-year quarter. Currency-neutral core earnings per share (EPS) also improved 6%. The upside was primarily driven by increased net sales and a lower core effective tax rate.
Sales in Details
P&G’s reported net sales of $17.4 billion surpassed the Zacks Consensus Estimate of $17.34 billion. The top line grew 3% from the year-ago level. Foreign exchange had a 1% positive impact on sales.
Organically (excluding the impact of acquisitions, divestitures and foreign exchange), revenues grew 2% on the back of a 2% increase in organic volumes. However, price had a 1% negative impact on sales.
Of the five business segments, three registered positive organic sales growth. Beauty, Health Care and Fabric & Home Care segments registered organic sales growth of 9%, 4% and 3% respectively, in the quarter in the group. Grooming and Baby, Feminine & Family Care segments, on the other hand, registered 3% and 1% organic sales decline, respectively.
Net sales of the Beauty, Health Care and Fabric & Home Care segments grew 10%, 7% and 3%, respectively. However, Grooming and Baby, Feminine & Family Care segments witnessed 1% revenue decline each in the quarter.
Procter & Gamble Company (The) Price, Consensus and EPS Surprise
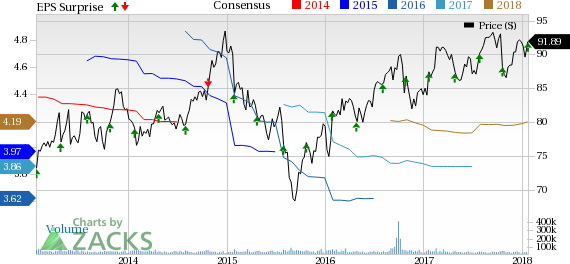
Procter & Gamble Company (The) Price, Consensus and EPS Surprise | Procter & Gamble Company (The) Quote
Margins
Core gross margin decreased 80 basis points (bps) to 50.7%, as productivity savings and higher sales were more than offset by headwinds such as increased commodity costs, unfavorable geographic and product mix, unfavorable pricing impacts and product reinvestments.
Core selling, general and administrative expense (SG&A) margin decreased 80 bps (as a percentage of sales) to 27.2% driven by productivity savings from overhead, higher revenues, agency fee and ad production costs. Core operating margin decreased 10 bps year over year to 23%.
Productivity cost savings contributed 190 bps of margin benefit in the quarter. P&G has been cutting costs aggressively to reduce spending across all areas like supply chain, research & development, marketing and overheads.
Financials
As of Dec 31, 2017, the company’s cash and cash equivalents were $7.4 billion, up from $5.6 billion at the end of fiscal 2017 (as of Jun 30, 2017). Long-term debt was $22.2 billion as of Dec 31, 2017, up from $18 billion at the end of fiscal 2017.
Cash flow from operating activities was $7.3 billion in the first six months of fiscal 2018, up from $6 billion a year ago.
Fiscal 2018 Guidance
The Cincinnati, OH-based company maintained its projection for the year and expects organic sales growth in the range of 2-3% for fiscal 2018. All-in sales growth is expected to about 3%.
The company has lifted its core EPS growth projection to 5-8% (versus 5-7% expected earlier) compared with fiscal 2017 core earnings of $3.92 per share. The upbeat view primarily reflects the potential benefit from the Tax Act.
On a GAAP basis, EPS is expected to decrease 30% to 32% (as against 26% to 28% decrease expected earlier) against fiscal 2017 GAAP EPS of $5.59, which included a significant benefit from the Beauty Brands transaction that was completed in October 2016. The fiscal 2018 GAAP EPS estimate includes approximately 10 cents per share of non-core restructuring costs and 24 cents per share of non-core charges related to the Tax Act.
P&G carries a Zacks Rank #3 (Hold). You can see the complete list of today’s Zacks #1 Rank (Strong Buy) stocks here.
Upcoming Peer Releases
Mondelez International, Inc. (NASDAQ:MDLZ) and The Hershey Company (NYSE:HSY) is slated to report fourth-quarter numbers on Jan 31 and Feb 2, respectively.
The Kraft Heinz Company (NASDAQ:KHC) is expected to report fourth-quarter results on Feb 21.
Wall Street’s Next Amazon (NASDAQ:AMZN)
Zacks EVP Kevin Matras believes this familiar stock has only just begun its climb to become one of the greatest investments of all time. It’s a once-in-a-generation opportunity to invest in pure genius.
Hershey Company (The) (HSY): Free Stock Analysis Report
Mondelez International, Inc. (MDLZ): Free Stock Analysis Report
The Kraft Heinz Company (KHC): Free Stock Analysis Report
Procter & Gamble Company (The) (PG): Free Stock Analysis Report
Original post
Zacks Investment Research