
The Priceline Group Inc. (NASDAQ:PCLN) reported better-than-expected third-quarter 2017 earnings.
Non-GAAP net earnings of $35.22 per share beat the Zacks Consensus Estimate by 91 cents and were better than the guided range of $32.4-$34.1 per share. Earnings increased over twofold sequentially and 18.6% year over year.
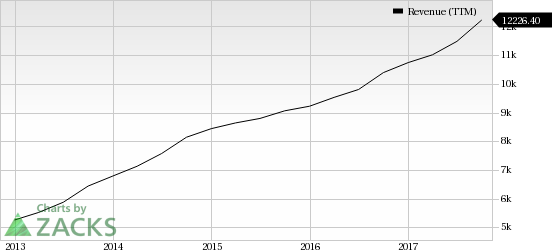
Revenues of $4.43 billion beat the Zacks Consensus Estimate by $89 million and were up a whopping 46.6% sequentially and 20.1% year over year.
On a year-over-year basis, both agency and merchant business showed strong momentum. Room nights and Rental cars performed impressively. The only point of weakness was airline tickets. On the call, management stated that the company will continue to focus on investments in people, systems and marketing with a long-term outlook.
Overall, we remain positive about the secular growth trend in the online travel booking market, Priceline’s strong position in international markets, growth opportunities in the domestic market, good execution, prudent marketing strategy and strong financial position.
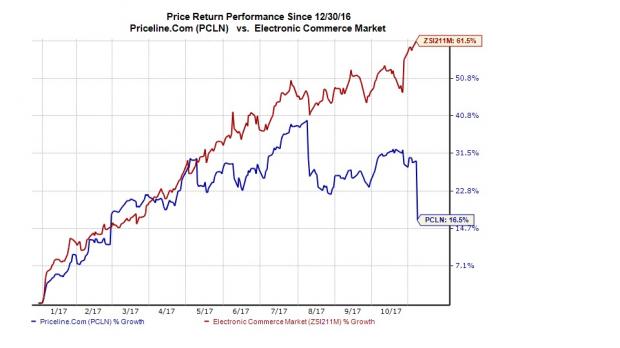
However, weaker average daily rates for accommodations (ADR), macro headwinds, increasing advertising spend and occupancy tax-related litigation remain overhangs. Year to date, the stock has surged 16.5%, significantly underperforming the industry’s gain of 61.5%.
Let’s check out the numbers.
Revenues in Details
Priceline generates the bulk of its revenues from international markets where the agency model is more popular. This is reflected in the merchant/agency split of revenues, which was 16/77% in the third quarter (previous quarter split was (15/79%).
Merchant revenues were up 37.4% sequentially and 10.3% year over year. Agency revenues increased 51.1% sequentially and 21.8% year over year.
Advertising & Other revenues were up 16.5% sequentially and 27.1% from last year. This is basically non inter-company revenues from Kayak and OpenTable.
The Priceline Group Inc. Revenue (TTM)
On a sequential basis, room nights volumes increased 4.3%. However, rental car days decreased 8.9% and airline tickets were down 5.9%. On a year-over-year basis, room nights were up 18.6%, rental car days increased 5.5% while airline ticket volumes were down 11.8%.
Priceline’s room night growth is attributable to its geographically diverse inventory and brand recognition that tends to balance out macro uncertainties related to any one market, as well as growing competition from local and international players. The company saw average daily rates for accommodations or ADRs decline 1% year over year. Rentalcars.com also did quite well but there was some softness in ticket volumes.
Bookings
Priceline’s overall bookings were up 4.6% sequentially and 17.9% (16% in constant currency) year over year and were at the higher end of the guided range.
Merchant bookings were up 11.2% sequentially and 17.2% year over year. Agency bookings increased 3.6% sequentially and 18% from the year-ago levels.
Margins and Net Income
Priceline reported pro forma gross margin of 98.7%, up 106 basis points (bps) sequentially and 141 bps year over year.
Owing to the nature of its business and the mix of agency versus merchant revenues, management usually uses gross profit dollars rather than margin to gauge performance during any quarter. Priceline’s gross profit dollars were up 48.2% sequentially but up 21.9% (19% in constant currency) from last year. It was also higher than the guidance. International gross profit grew 23% (20% on a constant currency basis). U.S. gross profit grew 11% from last year.
Priceline’s adjusted operating income was up triple digit sequentially and 18.2% year over year to $2.1 billion. Operating margin of 48.4% was up 1749 bps sequentially but down 78 bps from the year-ago quarter.
Priceline’s GAAP net income was $1.7 billion or $34.43 a share, compared with $720.2 million, or $14.39 a share in the June quarter and $506 million, or $10.13 a share in the year-ago quarter.
Balance Sheet
Priceline ended the quarter with cash and short-term investments balance of $7.3 billion compared with $6.4 billion at the end of the second quarter. As of Sep 30, 2017, Priceline generated $3.5 billion of cash from operations. It spent around $223.7 million on capex and $1.1 billion on share repurchases.
At quarter-end, Priceline had $8.7 billion in long-term debt. Net debt was $5.9 billion compared with net debt of $4.9 billion in the previous quarter.
Guidance
For the fourth quarter of 2017, Priceline expects room nights booked to grow 8-13% and total gross bookings to increase 9.5-14.5% year over year (5.5-10.5% on a constant currency basis).
Notably, this guidance indicates a slowdown in growth rates of room nights booked and total gross bookings as it is the lowest compared to the last five quarters. Investors seem to be worried about this overly conservative guidance as reflected in the 9.4% decline in stock price in afterhours trading.
Priceline expects gross profit dollars to increase 10.5-15.5% (6%-11% on a constant currency basis), with adjusted EBITDA in the range of $870-910 million.
Pro forma EPS is expected to come in the range of $13.4-$14, lower than the Zacks Consensus Estimate of $15.6. GAAP EPS is expected in the range of $12.6-$13.2.
Zacks Rank and Stocks to Consider
Priceline currently has a Zacks Rank #3 (Hold).
Better-ranked stocks in the broader technology sector include Adobe Systems Incorporated (NASDAQ:ADBE) , Fair Isaac Corporation (NYSE:FICO) and Autohome Inc. (NYSE:ATHM) , all sporting a Zacks Rank #1 (Strong Buy). You can see the complete list of today’s Zacks #1 Rank stocks here.
Long-term earnings growth rate for Adobe, Fair Isaac and Autohome is projected to be 17%, 10% and 18.8%, respectively.
Zacks' Hidden Trades
While we share many recommendations and ideas with the public, certain moves are hidden from everyone but selected members of our portfolio services. Would you like to peek behind the curtain today and view them? Starting now, for the next month, I invite you to follow all Zacks' private buys and sells in real time from value to momentum...from stocks under $10 to ETF to option movers...from insider trades to companies that are about to report positive earnings surprises (we've called them with 80%+ accuracy). You can even look inside portfolios so exclusive that they are normally closed to new investors.
Click here for Zacks' secret trade>>
The Priceline Group Inc. (PCLN): Free Stock Analysis Report
Autohome Inc. (ATHM): Free Stock Analysis Report
Fair Isaac Corporation (FICO): Free Stock Analysis Report
Adobe Systems Incorporated (ADBE): Free Stock Analysis Report
Original post
Zacks Investment Research