On Tuesday we looked at stocks, followed by yesterday’s review of bonds. Today we turn to commodities for this series of articles that’s focused on profiling momentum across the major asset classes, according to a set of proxy ETFs.
The analytical lens is once again a two-part toolkit: 50- and 200-day moving averages, along with the trailing one-year return (252 trading days). The goal: develop some intuition about the near-term outlook for various slices of the global markets. Since the agenda is analyzing price trends, we’ll strip out distributions and look at price-only data (as of December 28), using charting resources via StockCharts.com.
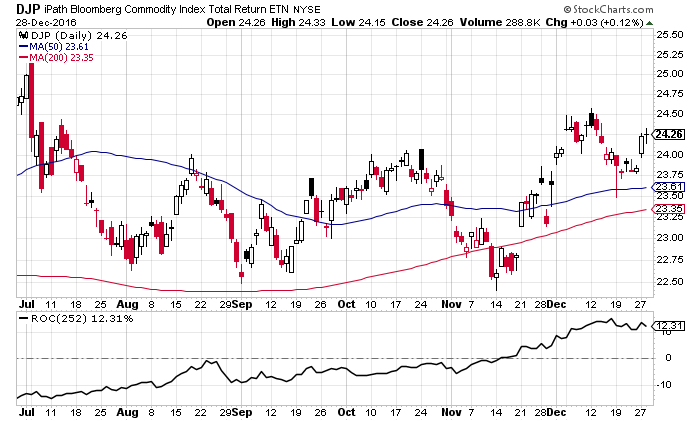
Let’s begin with a big-picture overview. As the first chart shows, upside momentum is prominent for commodities generally. The iPath Bloomberg Commodity (NYSE:DJP) is posting positive one-year returns lately while the ETN’s price continues to hold well above the 50- and 200-day moving averages. In short, Mr. Market’s near-term forecast for commodities looks modestly bullish.
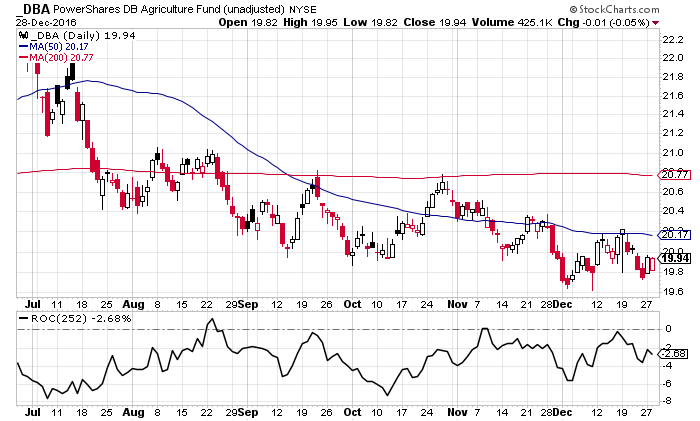
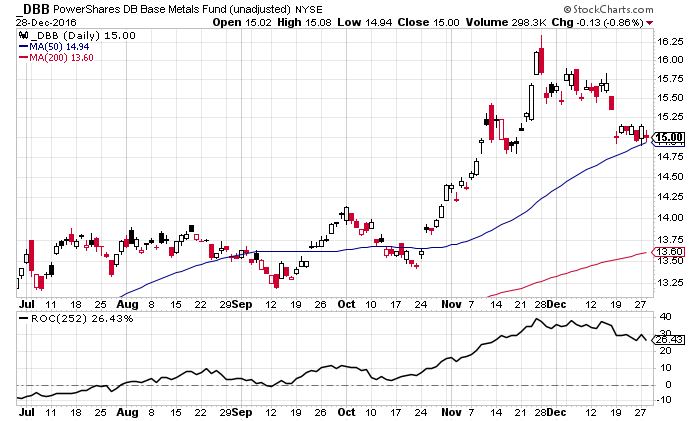
Does the positive trend from the 30,000-foot level apply to the sub-categories? For some insight, let’s take a selective tour of underlying components for a broad-brush definition of commodities, starting with two representative funds: PowerShares DB Agriculture (NYSE:DBA) and PowerShares DB Base Metals (NYSE:DBB).
In contrast with the upbeat drift for commodities generally, agricultural prices are trending down, based on DBA. The fund’s trading well below its 50- and 200-day averages, and the 50-day average has been below the 200-day average for months. Not surprisingly, the one-year return for DBA is negative.
Meanwhile, the bulls are running the show with trading in base metals. DBB is the mirror opposite of DBA, suggesting that base metals are poised to start the new year on a positive note.
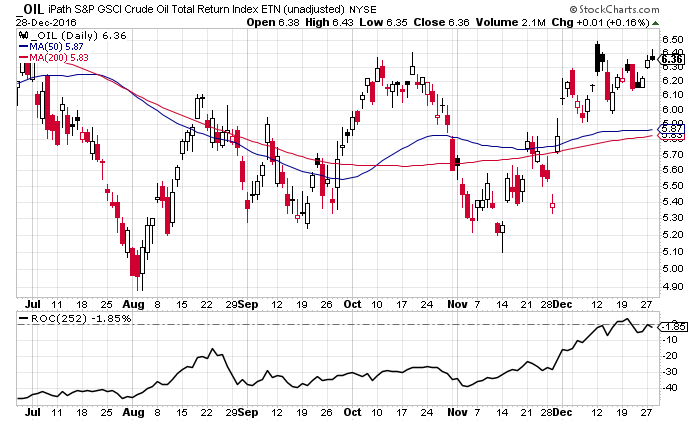
Crude oil is also trending positive these days. Recent trading suggests that iPath S&P GSCI Crude Oil (NYSE:OIL) is poised to touch its highest level since the summer.
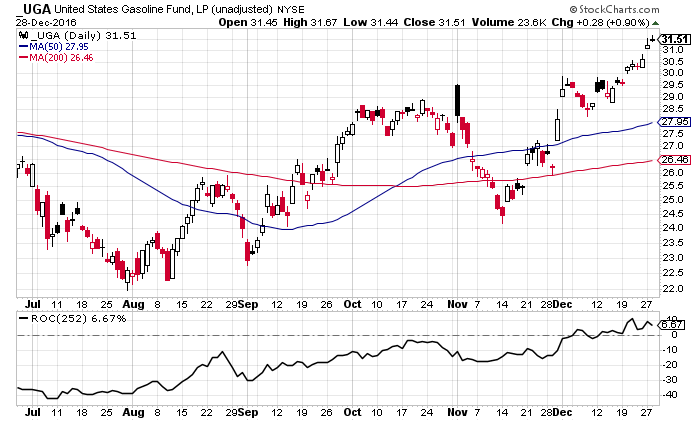
Moving on to gasoline, there’s no ambiguity here: the trend is red hot. In fact, United States Gasoline (NYSE:UGA) closed December 29 at its highest price in more than a year.
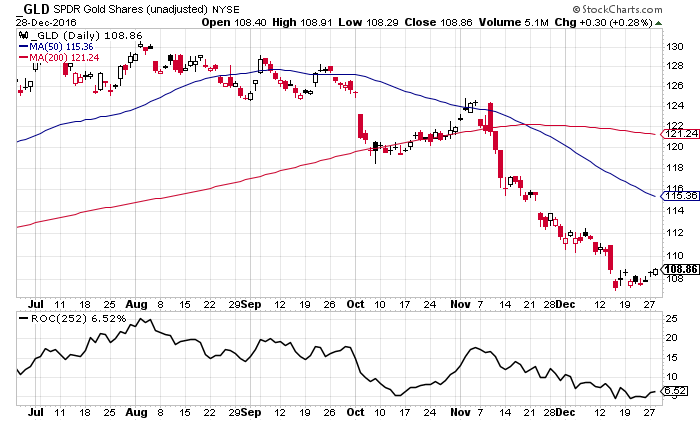
Gold, on the other hand, is having rough period. After rallying in the first half of 2016, everyone’s favorite precious metal has stumbled in the fourth quarter. Although SPDR Gold Shares (NYSE:GLD) still claims a moderate gain for the trailing one-year period, the technical picture has broken down, implying that the metal is looking at a rough start in the new year.
