In this week's market analysis, we will look at potential trading opportunities and zones where we should look for price action, evidence and potential moves.
Pairs and markets analyzed this week: EUR/MXN and GBP/JPY
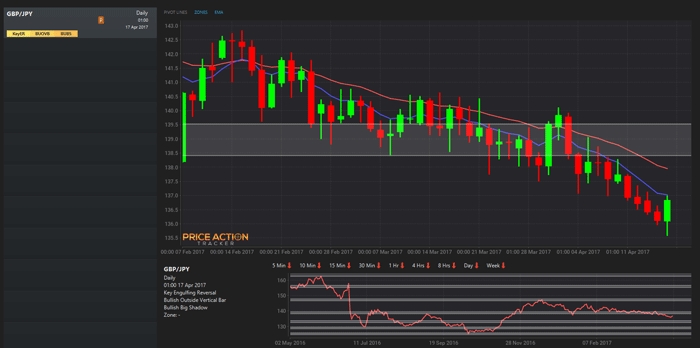
Big Shadow Pattern Daily Chart GBP/JPY
This candlestick has a Higher High and a Lower Low than the previous candlestick., it closes in its last third of the bar, there is “room” to the left and its range is bigger than the last 8 candles.
So all the conditions are met, we are dealing with a Big Shadow pattern (more info on this pattern here).
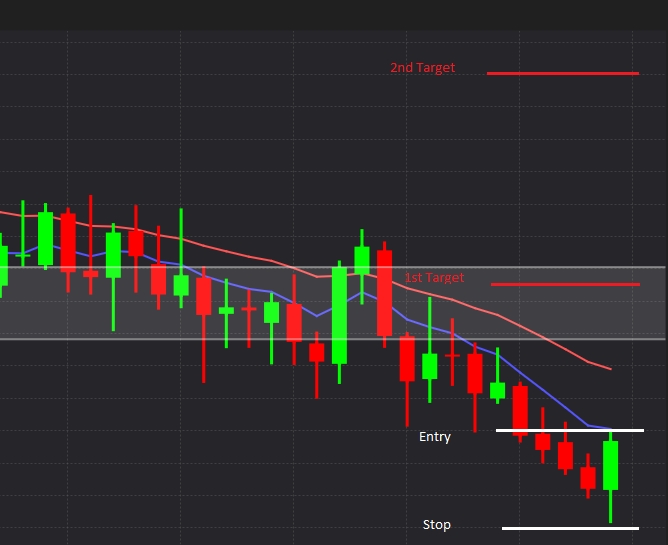
We are going to put our Entry 1 Pip above the high.
We are going to put our Stop 1 Pip below the low.
We are going to set our target, it s very important to know where you are aiming before entering a trade, in this case we are aiming for Target 2 which would give us a nice 5:1 ROI (ex: $100 risked would yield $500).
We also want to keep an eye on our first management point as the 138.5-139.5 area is a well known event area ( S/R ).
Big Shadow patterns are great to trade, but like all price action setups and patterns, they perform better when used in conjunction with key resistance levels.
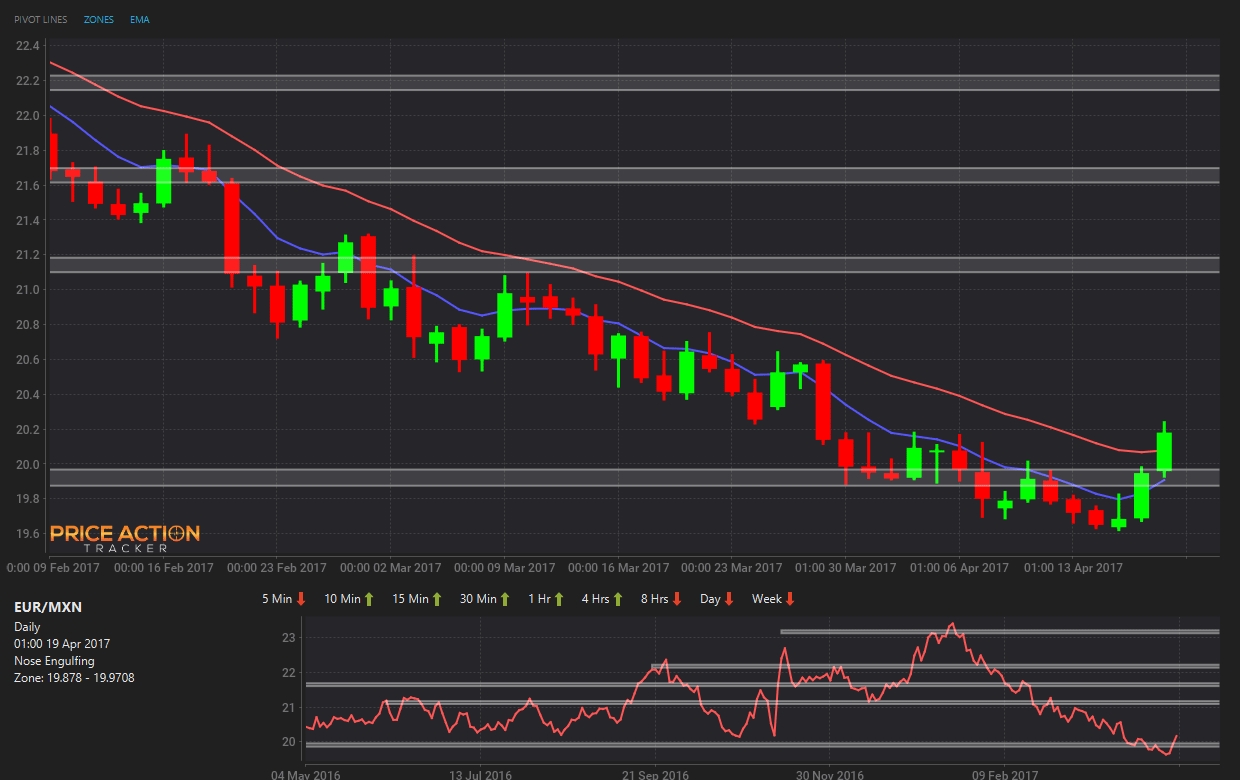
Nose Engulfing Pattern Daily Chart EUR/MXN
Price finally broke a major support area (19.878-19.9708) and the daily 8 / 21 EMA dynamic support layer so we could be looking at a potential move to the upside from this zone.
Target Level: 21.0
Disclaimer: This is educational and general information only (not advice or a recommendation).
Trading financial instruments, including Stocks, Futures, Forex or Options on margin, carries a high level of risk and is not suitable for all investors. The high degree of leverage can work against you as well as for you. Before deciding to invest in financial instruments or foreign exchange you should carefully consider your investment objectives, level of experience, and risk appetite. The possibility exists that your losses can exceed deposits and therefore you should not invest money you cannot afford to lose. You should be aware of all the risks associated with trading and seek advice from an independent financial advisor if you have any doubts. Past performance, whether actual or hypothetical, is not necessarily indicative of future results. All depictions of trades whether by video or image are for illustrative purposes only and not a recommendation to buy or sell any particular financial instrument. See full risk disclosure. By viewing this site's Content or Videos you agree to the privacy and disclaimer.


