
Prestige Consumer Healthcare, Inc. (NYSE:PBH) came out with third-quarter fiscal 2019 results, wherein adjusted earnings beat the Zacks Consensus Estimate, while sales lagged the same. Moreover, sales declined year over year, owing to sluggish performance in North American and International segments. This may have marred investors’ sentiments as the stock fell 4.6% yesterday.
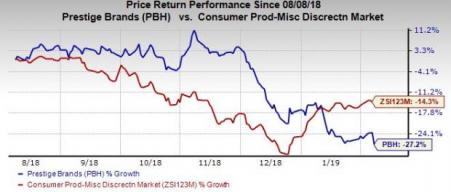
We also note that shares of this Zacks Rank #4 (Sell) company lost 28.3% in the past six months, underperforming the industry’s decline of 14.7%.
Q3 Details
The company posted adjusted earnings of 73 cents per share, up 4.3% from the year-ago quarter’s 70 cents. This upside can be attributed to a solid financial status and robust free cash flow. Also, the figure surpassed the Zacks Consensus Estimate of 71 cents and marked its fourth consecutive quarter of earnings beat.
Total revenues of $241.4 million missed the Zacks Consensus Estimate of $244 million. The top line dropped 10.8% year over year. Further, organic revenues decreased 3.1% on reduced inventory. Organic revenues don’t include the impact of sale of the Household Cleaning segment and any foreign currency movements.
Gross profit came in at $139.2 million, reflecting a decline of 5.7% from the prior-year quarter’s figure. However, gross margin expanded 310 basis points (bps) to 57.7% in the fiscal third quarter, primarily driven by the divestiture of the Household Cleaning segment, change in revenue recognition accounting policies and the timing of associated costs.
Adjusted EBITDA was $85.2 million, down 7.2% year over year, owing to the household segment divestiture, packaging expenses of Goody’s and BC brands, and significant inventory reductions. Adjusted EBITDA margin expanded 140 bps to 35.3%.
Segment Performance
Following the divestiture of the Household Cleaning segment on Jul 2, 2018, Prestige Consumer is currently operating two segments — the North American OTC Healthcare and the International OTC Healthcare.
Revenues in the North American OTC Healthcare segment amounted $216.8 million, down 3.9% year over year, owing to reduced inventory at certain key retailers.
Revenues in the International OTC Healthcare segment totaled $24.6 million, down 4.3% from the year-ago quarter. The decline was attributable to unfavorable impact of foreign currency and normalization of differences in shipments and distributor orders.
Financial Updates
The company exited the quarter under review with cash and cash equivalents of $24.7 million, net long-term debt of $1,895.8 million and shareholders’ equity of $1,842.3 million. During the quarter, the company lowered its debt by $55 million, and in the nine months ending Dec 31, 2018, it reduced debt by $155 million. Net cash provided by operating activities in the quarter was $43.3 million.
Prestige Consumer Healthcare Inc. Price, Consensus and EPS Surprise
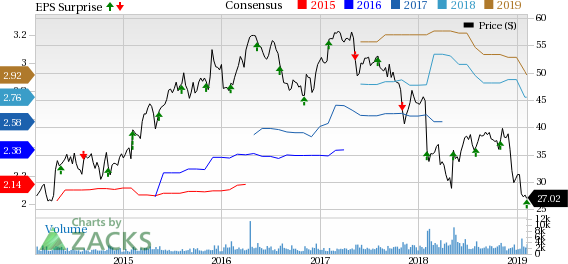
Prestige Consumer Healthcare Inc. Price, Consensus and EPS Surprise | Prestige Consumer Healthcare Inc. Quote
Outlook
The company retained its fiscal 2019 outlook. Management continues to expect revenues of $970-$975 million, with organic revenue growth anticipated to range between flat and increase 0.5%. Further, adjusted earnings per share is still projected to be $2.75-$2.78 whose mid-point of $2.77 is slightly above the Zacks Consensus Estimate of $2.76. Moreover, gross margin for fiscal 2019 is still expected to be approximately 57%. Additionally, adjusted free cash flow is anticipated to come in at least $200 million.
Moving on, Prestige Consumer is on track with its three core strategies that resulted in solid free cash flow. This, in turn, enabled the company to lower its debt to a certain extent in the quarter. Prestige Consumer is gaining on strength in leading brands that offset the impact of inventory reductions in the quarter under review. Going ahead, the company is well-positioned for long-term growth with a strong and diversified product portfolio. Also, it is striving to maintain a strong balance sheet and cost-effective capital allocation, and return high value to shareholders.
Stocks to Consider
Funko, Inc. (NASDAQ:FNKO) , carrying a Zacks Rank #1 (Strong Buy), has a long-term growth rate of 22%. You can see the complete list of today’s Zacks #1 Rank stocks here.
Deckers Outdoor Corporation (NYSE:DECK) , with long-term earnings per share growth rate of 11.9%, carries a Zacks Rank #1.
Columbia Sportswear Company (NASDAQ:COLM) , carrying a Zacks Rank #1, has long-term growth rate of 10.9%.
The Hottest Tech Mega-Trend of All
Last year, it generated $8 billion in global revenues. By 2020, it's predicted to blast through the roof to $47 billion. Famed investor Mark Cuban says it will produce "the world's first trillionaires," but that should still leave plenty of money for regular investors who make the right trades early.
See Zacks' 3 Best Stocks to Play This Trend >>
Prestige Consumer Healthcare Inc. (PBH): Get Free Report
Deckers Outdoor Corporation (DECK): Free Stock Analysis Report
Columbia Sportswear Company (COLM): Get Free Report
Funko, Inc. (FNKO): Free Stock Analysis Report
Original post
Zacks Investment Research