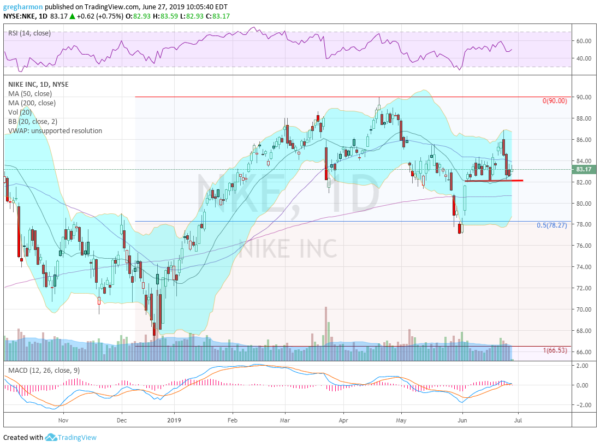
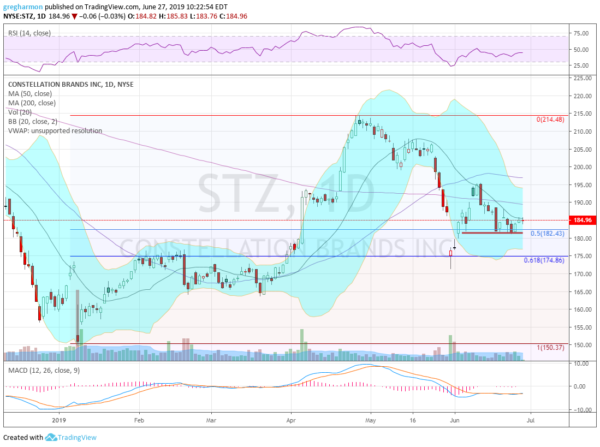
Two names today one that reports after the close tonight, Nike (NYSE:NKE), $NKE, and one before the open Friday, Constellation Brands (NYSE:STZ), $STZ.
Nike, $NKE

Nike, $NKE, rose from a December low to reach a peak in April. Since then it has pulled back, retracing 50% of the move and dropped under the 200 day SMA at the end of May. June has been better with a cross back over the 200 day SMA. It comes into the report holding over support near the 20 day SMA. It has a RSI holding at the mid line with the MACD leveling as it approaches zero and avoids a cross down. There is support lower at 82 and 80 then 77.25 and 75.60. There is resistance above at 84.20 and 86 then 88.30 and 90. The reaction to the last 6 earnings reports has been a move of about 4.03% on average or $3.35 making for an expected range of 80 to 86.75. The at-the money June 28 Expiry Straddles suggest a larger $4.30 move by Expiry with Implied Volatility at 107% above the July at 33%. Short interest is low under 1%. Open interest is spread from 75 to 85, biggest at 75 and 81 then 83 on the Put Side. On the Call side it is focused from 82.50 to 85 then at 88 and 80.50.
Trade Idea 1: Buy the June 28 Expiry 83/80.50 1×2 Put Spread for free.
Trade Idea 2: Buy the June 28 Expiry 83.50/85 Call Spread ($0.70) and sell the June 28 Expiry 79.50 Put for a 5 cent credit.
Trade Idea 3: Buy the June 28 Expiry/July 88 Call Calendar ($0.50) and sell the June 28 Expiry 78.50 Put for free.
Trade Idea 4: Sell the June 28 Expiry 78/88 Strangle for an $0.85 credit.
#1 gives the downside with leverage and a possible entry at 80.50. #2 and #3 give the upside using leverage and may put you in the stock at 79.50 (#2) or 78.50 (#3). #4 is profitable on a close between 77.15 and 88.85 at Expiry. I prefer #3 or #4.
Constellation Brands, $STZ

Constellation Brands, $STZ, started higher off of a January low. After a long consolidation it continued in April and made a top near the end of the month. It pulled back, retracing 61.8% of the move up and bounced. The bounce failed at the 20 day SMA and it fell back to a higher low and has been consolidating at the 50% retracement level. Into the report it is holding there and it has a RSI flat under the mid line and the MACD level and negative. There is support lower at 181.30 and 175 then 173 and 165 before 157 and 150. There is resistance above at 187 and 190 then 195 and 200 before 207.50 and 214.50. The reaction to the last 6 earnings reports has been a move of about 7.62% on average or $14.10 making for an expected range of 170.75 to 199.25. The at-the money June 28 Expiry Straddles suggest a smaller $9.90 move by Expiry with Implied Volatility at 111% above the July at 36%. Short interest is moderate at 4.4%. Open interest is biggest at 160 and 165 then spread from 170 to 185 on the Put Side. On the Call side it is biggest at 182.50 and then slowly trails off to 210.
Trade Idea 1: Buy the June 28 Expiry 185/180-177.50 1×2 Put Spread for free.
Trade Idea 2: Buy the June 28 Expiry 187.50/190 Call Spread ($1.25) and sell the June 28 Expiry 172.50 Put for 15 cents.
Trade Idea 3: Buy the June 28 Expiry/July 200 Call Calendar ($1.25) and sell the June 28 Expiry 172.50 Put for $0.15.
Trade Idea 4: Sell the June 28 Expiry 167.50/200 Strangle for a $1.00 credit.
#1 gives the downside with leverage and a possible entry at 177.50. #2 and #3 give the upside using leverage and may put you in the stock at 172.50. #4 is profitable on a close between 166.50 and 201 at Expiry. I prefer #2, #3 or #4.
Disclaimer: The information in this blog post represents my own opinions and does not contain a recommendation for any particular security or investment. I or my affiliates may hold positions or other interests in securities mentioned in the Blog, please see my Disclaimer page for my full disclaimer.
