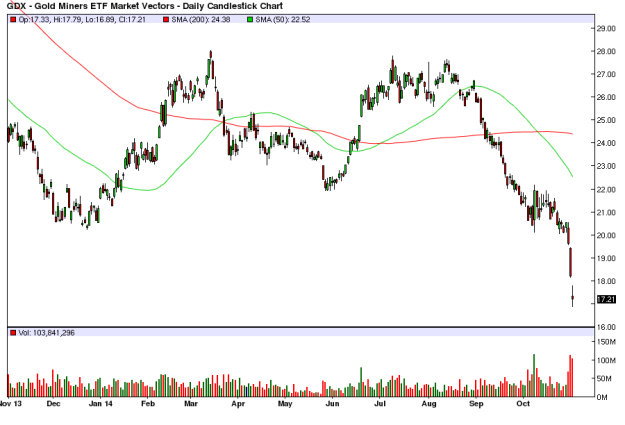
Chart 1: Gold mining companies were decimated in this weeks sell off!

This past week we saw mini turmoil in the Precious Metals sector. The selling pressure on huge volume is occurring on the back of news that the Federal Reserve has finally exited its third round of its bond purchasing program (the last bit of tapering is now complete). While the metals suffered from strong selling (Gold down 4.7% and Silver down 6%), it was the producers that took it on the chin, hard.
Gold miners declined 16%, while the yellow metal juniors were down a whopping 21%. Silver miners didn’t fare too much better, with producers declining over 14% and juniors down over 15%. Chart 1 shows that this week's panic came after Gold miners had already fallen about 25% from their recent peak in July to their support around $20 on the ETF.
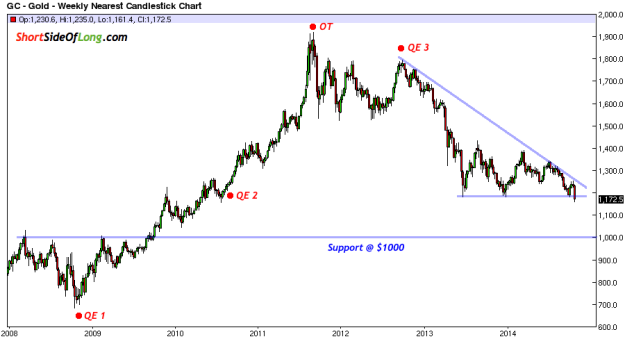
Chart 2: Gold prices are attempting to break down lower towards $1000

A few precious metals perma-bulls, that had called for a bottom in 2012 and 2013, have now once again called a bottom here. They claim that we are now in the process of liquidation and it's time to buy Gold miners (again). After the current round of selling, I’ve also received a few emails asking me if I will be buying more PMs or literally telling me that the bottom is now in for sure.
Personally, I am not 100% sure that's true. I have stated many times that after a powerful advance of 12 annual gains in a row, Gold will most likely be correcting for a while and a re-test of the $1000 per ounce level should not be ruled out.
This past week we witnessed the beginning of the breakdown in Gold prices (refer to Chart 2) and this does NOT look like liquidation to me just yet. We have barley made a new 52 week low. I believe the selling pressure is just about to start, and if Gold was to fall toward $1000 or so, we could be close to a major bottom and a very important buying opportunity.
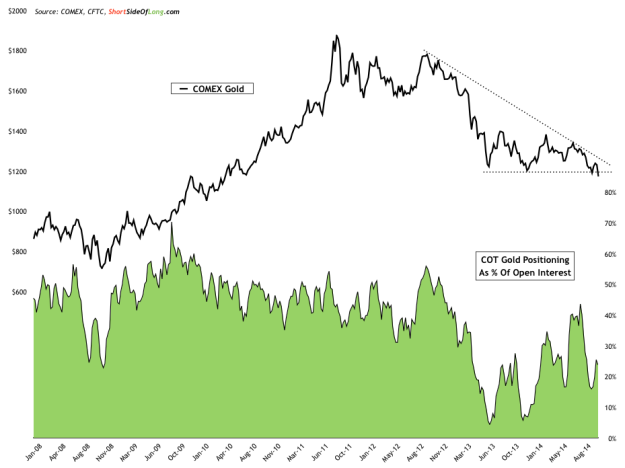
Chart 3: Shake out has a long way to go before we have a buy signal!

Positioning in Gold is still quite elevated, even though the COT report above does not include major selling days from Wednesday to Friday. Leading into the FOMC decision, hedge funds and other speculators held net longs equivalent to 25% of open interest. Assuming the strong selling later in the week forced even more hedge funds to be shaken out, we are still far away from levels we saw in June and December of 2013, when position was in single digit percentages.
Also of note: before a major bull market began in 2001, positioning on Gold stood at net short levels, something we have not seen in a decade and half. During the current correction, why couldn’t hedge funds and other speculators enter into a real panic state and actually turn net short Gold? I believe it is possible and would give a major contrarian buy signal.
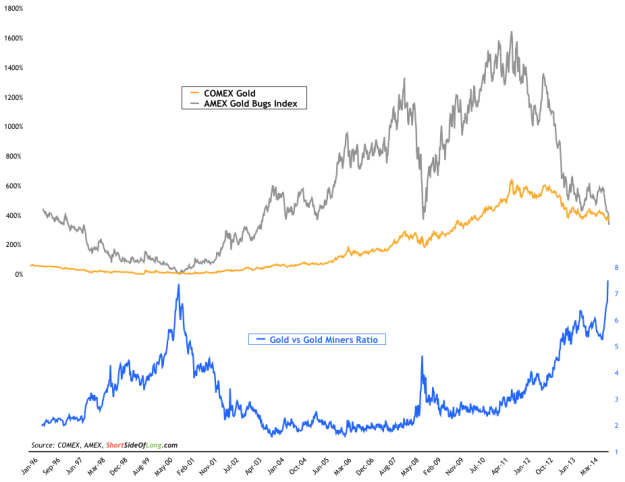
Chart 4: Miners offer amazing value, but Gold itself needs to bottom first

I want to make sure that my words aren’t getting minced in a blender here, so it looks like I’m jumping from the bullish bandwagon to the bearish one and back again. From the investment point of view, I continue to be a long term bull on Gold, and in particular Silver. I have never owned mining or producing companies, but I do admit that they are now becoming incredibly attractive as well (see Chart 4).
Regarding the investment outlook, one should always respect the tape and not argue with the market. That is why I am not buying any new positions just yet and have not bought for over a year now. That is also why I opened full hedged Silver as well as naked short positions on Gold in July of this year. While I eventually see a huge upside for both precious metals in the coming years, I do admit that the current trend is lower and the correction needs to bottom out first.
Disclosure: I opened yet another short on Gold at $1201 in Friday’s Asian trade, in anticipation of the triangle breaking lower (refer to Chart 2).
