Strength of the US dollar rally has pretty much surprised everyone

(Source: Short Side of Long)
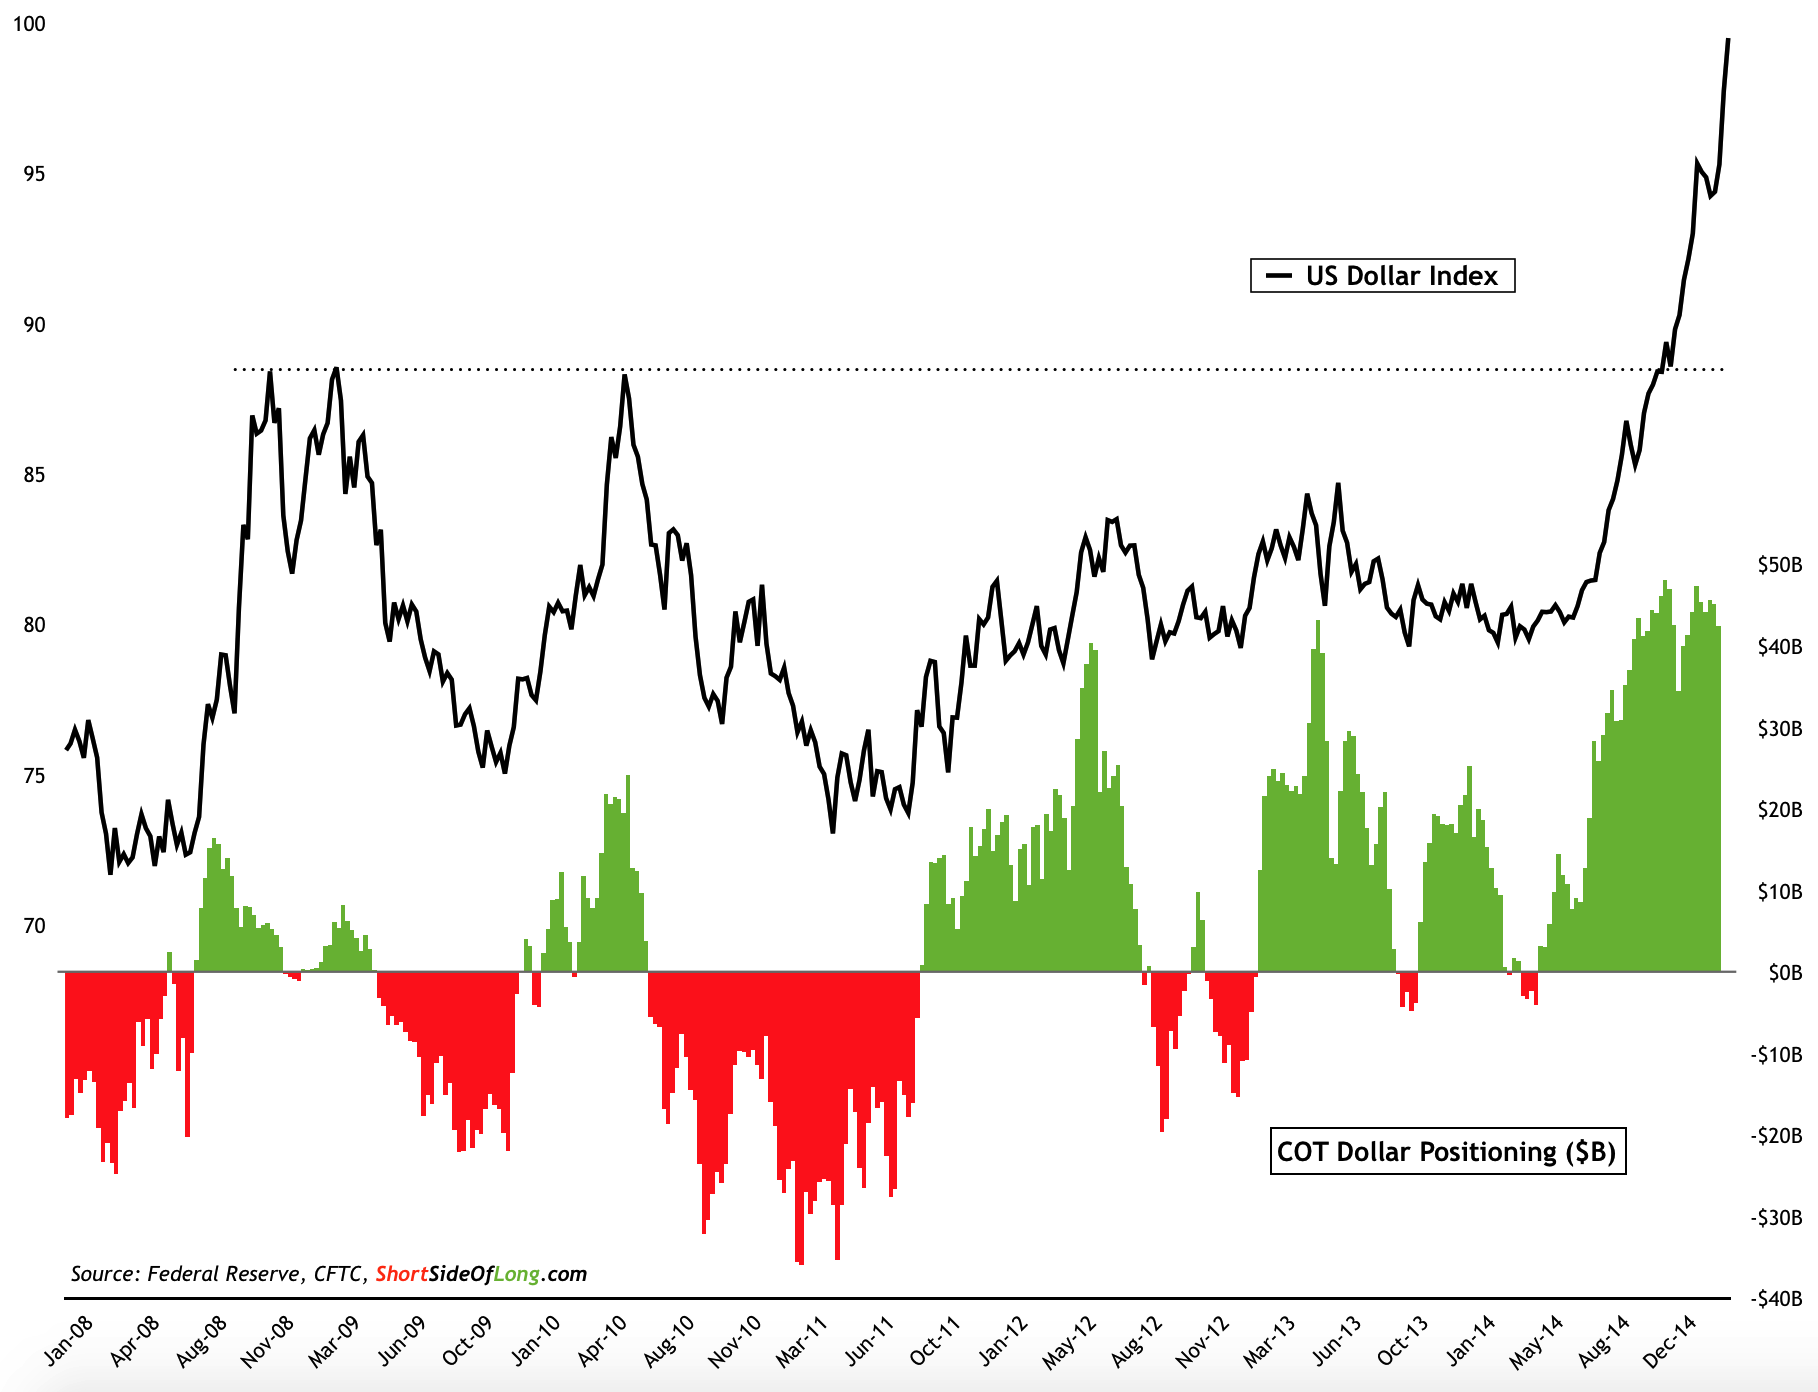
Today I am focusing on the Precious Metals sector. But before I discuss the price movements and sentiment, I would like to touch upon the US dollar. As we can clearly see in Chart 1, the greenback has been very hot since June of 2014, moving up in a straight parabolic fashion. I never expected the rally to be this strong and this sharp, and I'm sure 99% of other market participants didn't either.
Gold And Silver are now close to making new bear market lows

(Source: Short Side of Long)
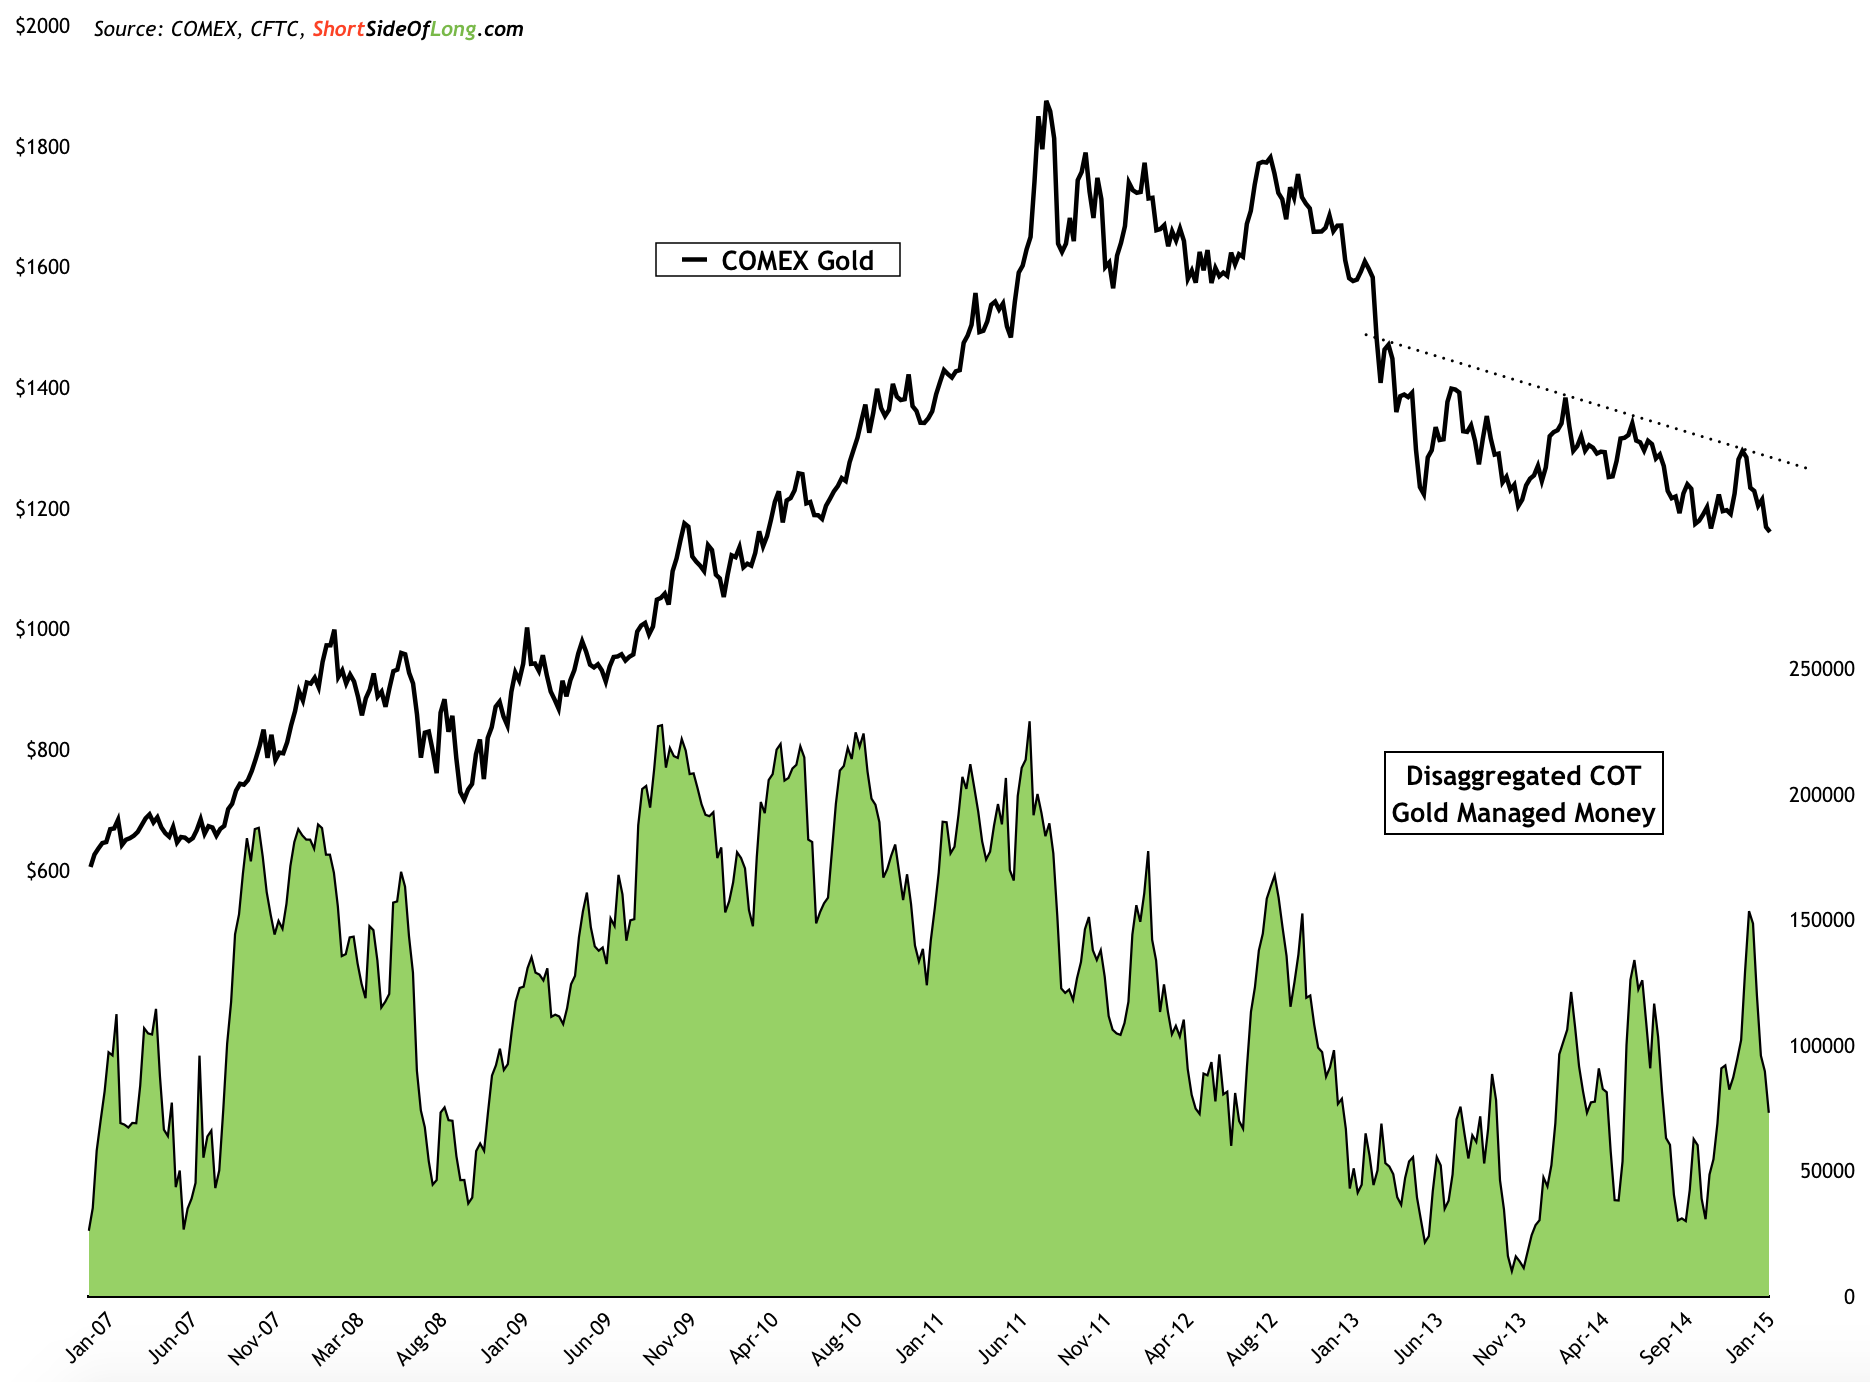
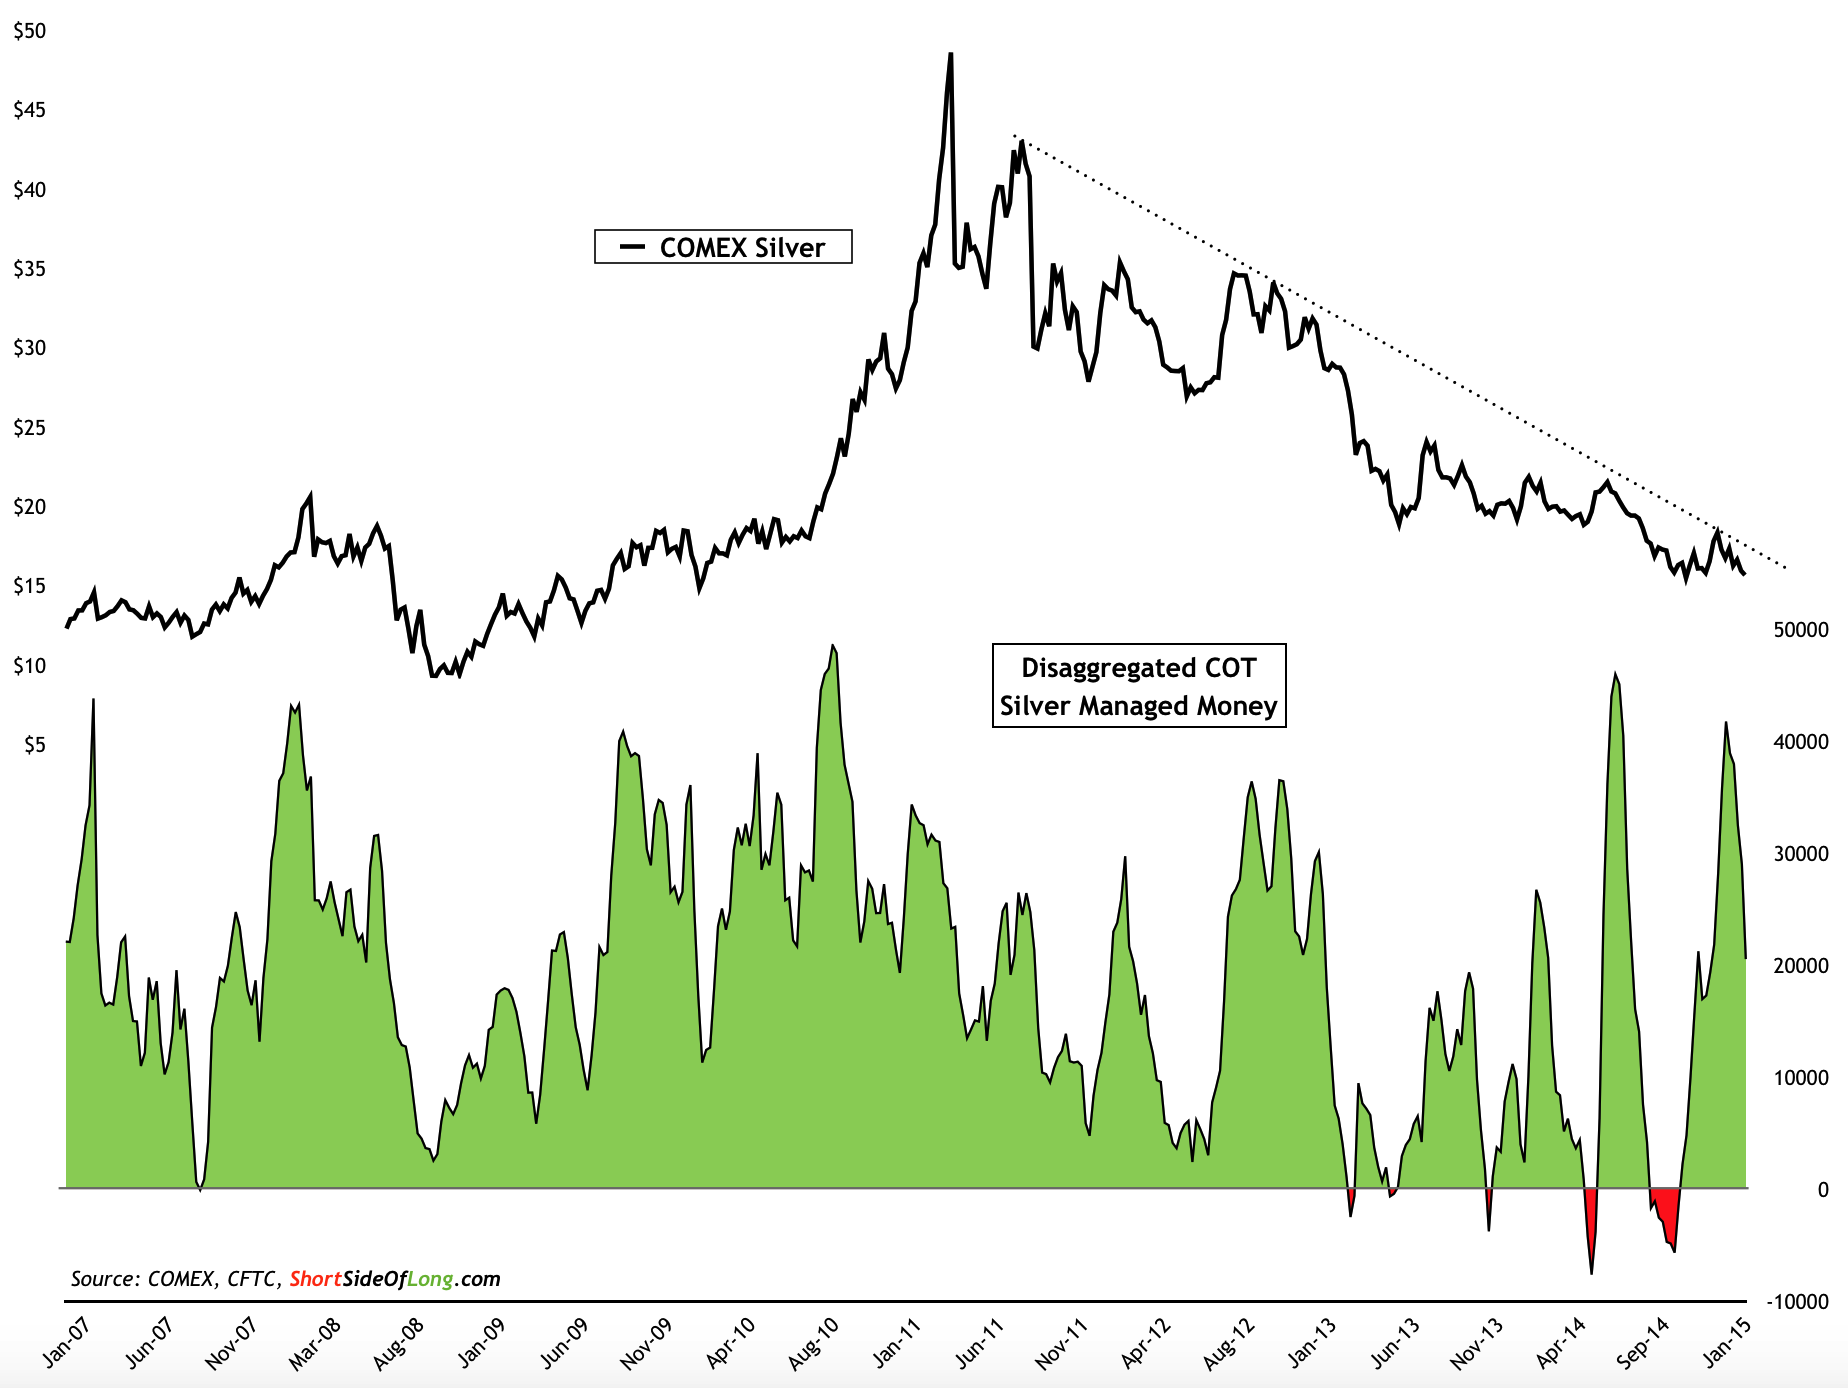
After all, focusing on the US dollar strength is important, as it remains one of the key drivers of Precious Metals weakness. Gold's mini-rally that occurred into January of 2015 has all but fizzled out and many are still scratching their heads as to why. Several weeks ago, I mentioned to my readers that both gold and silver failed to make a higher high and break through any meaningful resistance levels, while at the same time abundance of net long money joined the party.
This was a red flag and a warning signal, without a doubt. It seems that just about everyone was expecting a new uptrend in PMs with over 150,000 net long Managed Money contracts in gold and over 40,000 in silver. As we can see, those types of numbers usually mark a top and not a buying opportunity.
While majority of the net longs have not yet been shaken out

(Source: Short Side of Long)
Now, we are witnessing a potential breakdown in prices towards new 52 week lows and bear market lows. While majority of the hedge funds have still not been shaken out. In my humble opinion, a major bottom in gold will still occur around $1,000 per ounce, as discussed many times on the blog. More importantly, until we see hedge funds (COT Managed Money) get towards net short positions in both gold and silver, we most likely won't be near a meaningful bottom. As of last weeks COT update (refer to Chart 2 and 3), we are still a decent way from such an event.
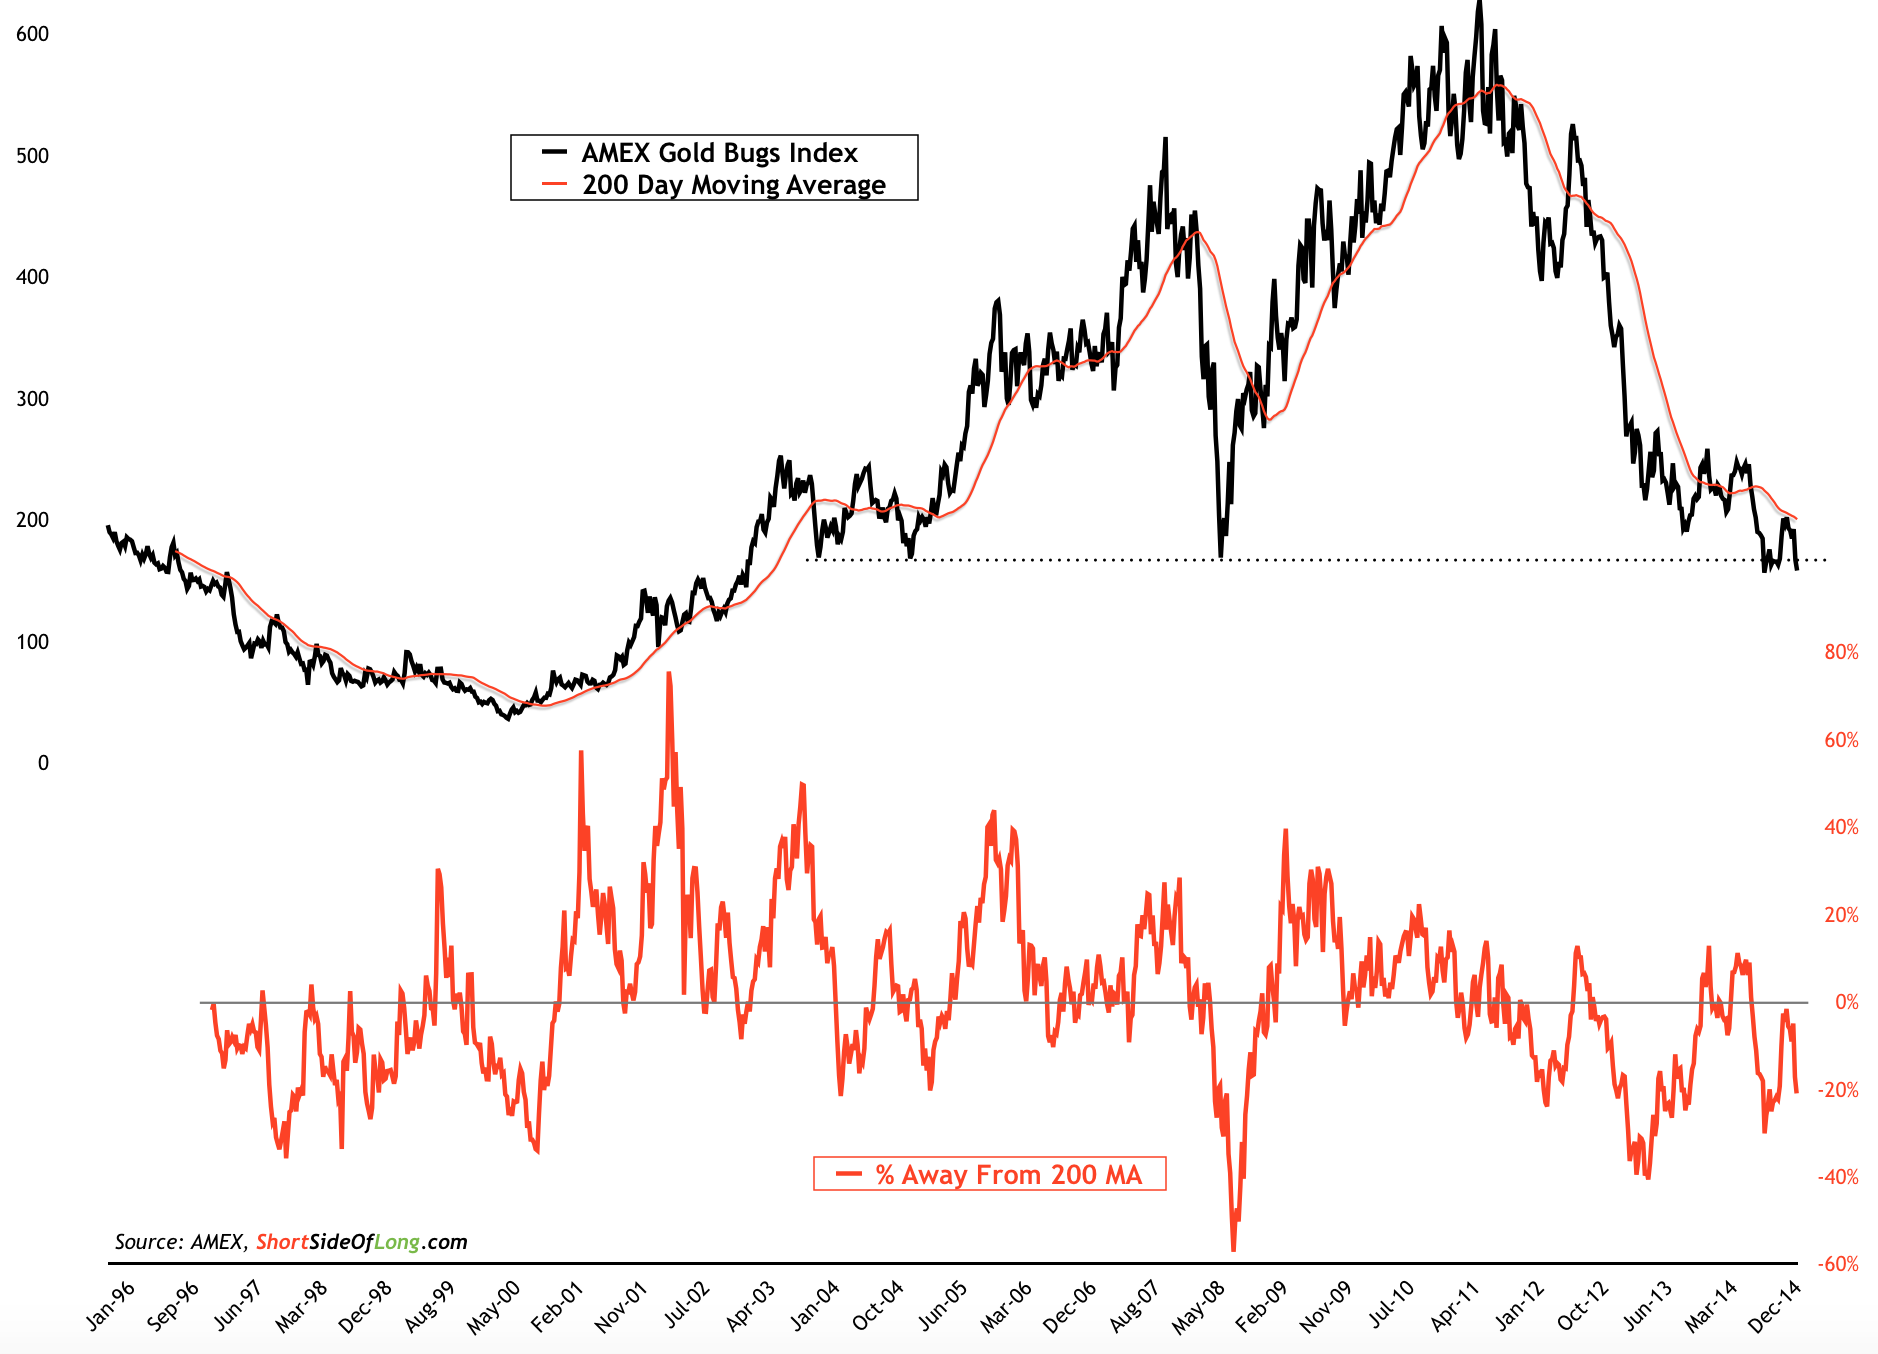
One final thing I would like to mention is the fact that gold miners, which are incredibly oversold already, are now flirting with a possibility of breaking below a critical support level (please refer to the chart below). The bear market has lasted almost 4 years now, so I am of the opinion that the final wash out below 160 in the HUI Index could be in the cards. This could end up being one of those false breakdowns that creates a huge amount of pessimism, followed by a super sharp and quick reversal.
Miners are in process of breaking below an important support

( Source: Short Side of Long)
Disclaimer: As mentioned many times on the blog, personally I was very fortunate to move all of my cash holdings into USD around that time, as well as add to my Aussie Dollar shorts later on in August of 2014. Now I am thinking of lightening up on my USD holdings, but have not yet done anything.
