Gold, silver and their quasi-industrial brothers, platinum and palladium are ignoring the USD playbook in the first two trading sessions of the year. Ignoring USD strength trampling over the G10 space and posting a quite constructive price action on the charts.
A few days does not a safe-haven rally make, in fact after so many years I always January price action with a grain of salt. That is a story for another day but there maybe a few short-term factors at work.
- In the spirit of safe havens, reality may be biting that we are only 16 days away from President-Elect Trump’s inauguration. I was bemused that his win was interpreted as the end of the world by the markets for a whole 12 hours before, in a herd-like turn a million wildebeest on the Serengeti would be proud of; global markets decided he would be the reflation Caligula the world had been searching for. Sending the USD, US Yields much higher and equities into the stratosphere. I have nothing against Mr Trump, in fact, I predicted his win. He is, and his policies are, however, a “known unknown.” This uncertainty may be playing its part as money moves into safe places to hide.
- A new year in China, a new years worth of allocation by the man on the street to move money out Chinese Yuan. $50,000 worth in fact. The depreciation of the currency against the USD and the possibility of a trade war is clearly resonating inside China. Confidence hasn’t been inspired by the PBOC’s tightening of movements out of the capital account. Precious metals could be seeing some beneficial spillover.
- Positioning. Major gold ETF’s have seen substantial declines in holdings recently. Speculative short positioning has also increased on the futures. We may well just be seeing a short squeeze due to short-term positioning. Time will tell on this one.
- US Yields have dipped overnight and into Asia across the curve. This probably explains the price action in USD/JPY today more than gold but US Yields are in fact a substantial distance now of their recent highs. (See the hourly U.S. 10-Year below. Note it is quoted inverted)
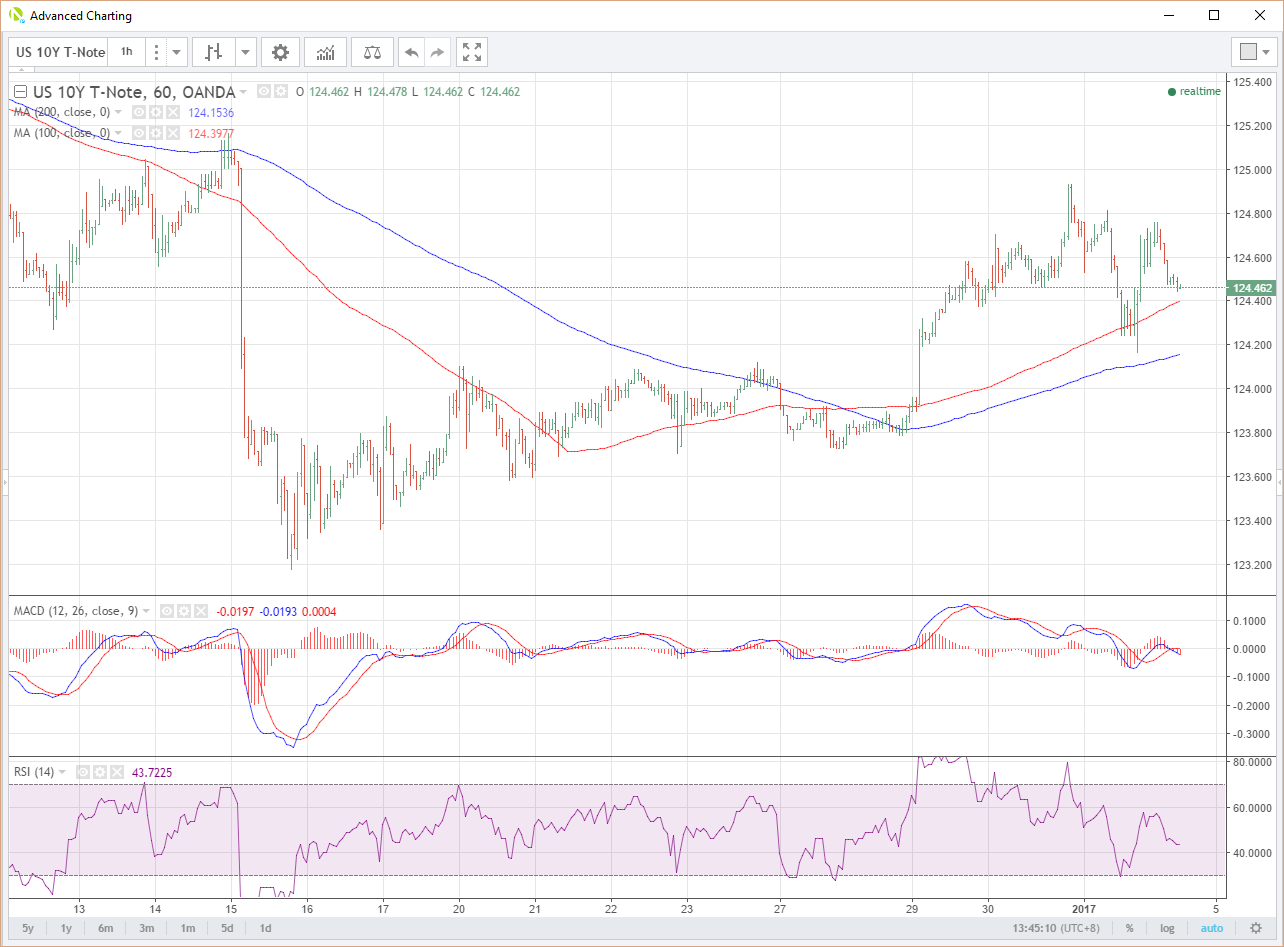
US 10 Year Hourly Chart
Taking a look at the charts…
GOLD
Gold has well and truly broken out of its downwards channel over the holiday period and consolidated that gain.
Resistance is at 1165, yesterday’s high, initially. Then the 1200 area, the original breakdown that started the panic and then the 1250/1270 area with the 100 and 200-day moving averages.
Support lies at the recent daily low at 1122.50 with 1050 my next big level after that.
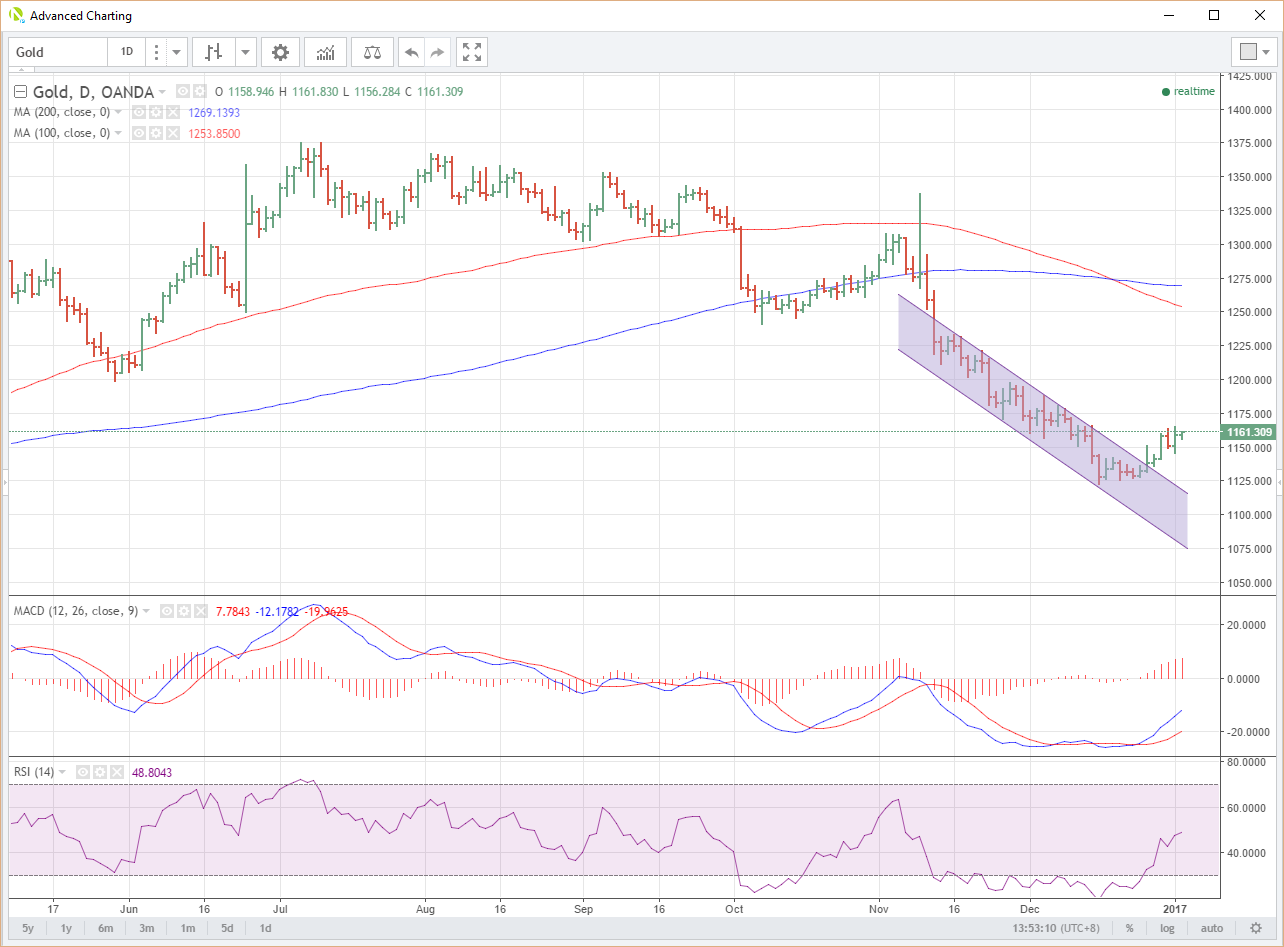
Gold Daily
SILVER
Silvers price action isn’t as constructive as gold’s, but a storming day yesterday broke the recent highs at 16.2950 and now becomes short-term support. This is not too surprising as the original wash-out was much more painful due to the amount of long positioning put on above 20.0000 earlier this year. Once burnt….
Resistance sits at yesterday’s high at 16.5100, then a multiple daily high at 17.2375 and then 17.8100/17.8200 where the 100 and 200-day moving averages now converge.
Support lies at 15.6225 the recent daily lows. I note that the short-term MACD has crossed higher and that the RSI has moved nicely into neutral territory.
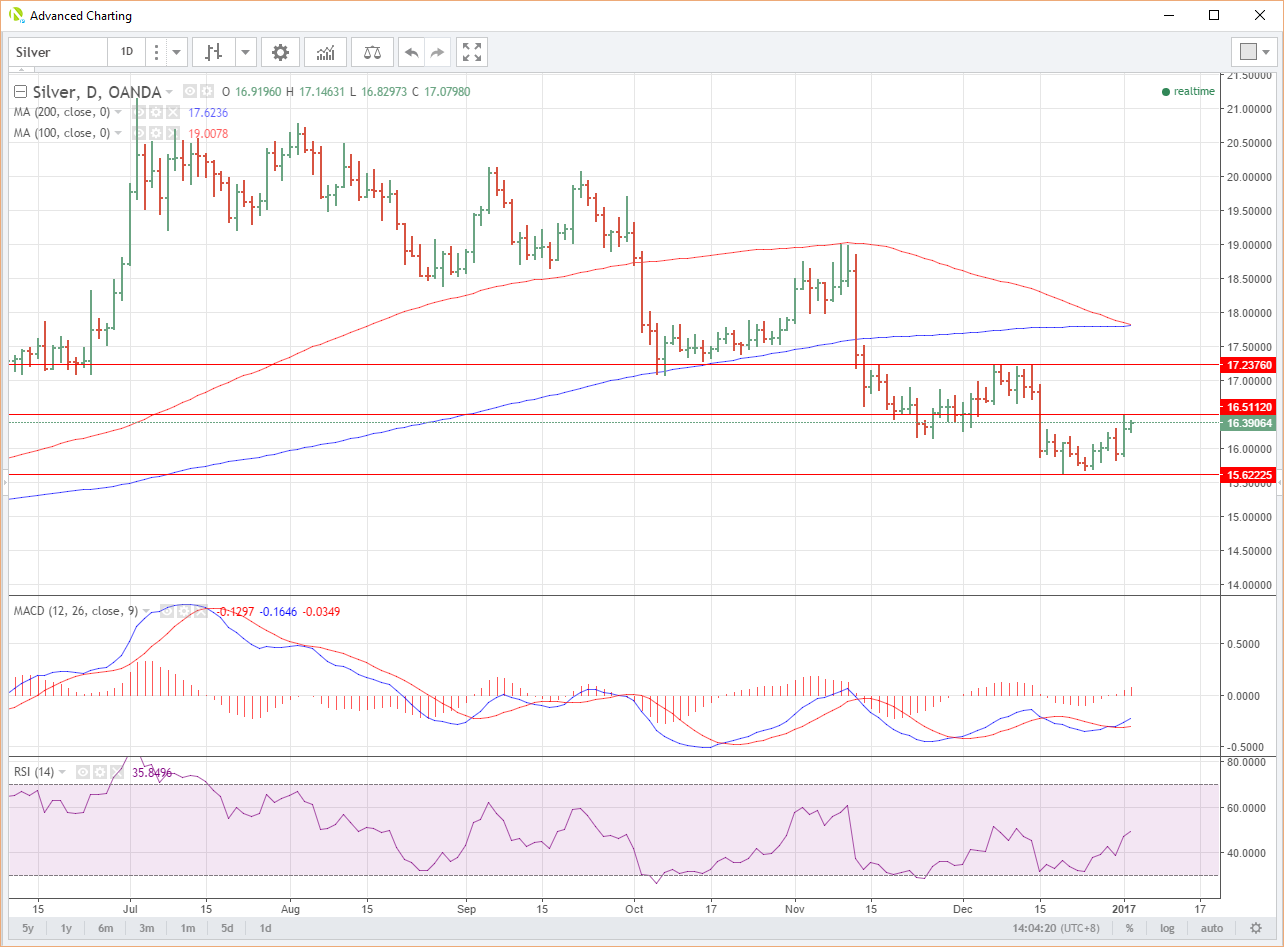
Silver Daily
PLATINUM
Again, very constructive short-term price again having broken its recent downtrend resistance at the 900 area. Support is at the recent low, 888.60.
Resistance is yesterday’s high at 945.40 and then a substantial multi-day top at 952.40. This will be a hard nut to crack, but a daily close above opens up the 1000 region again from a technical perspective.
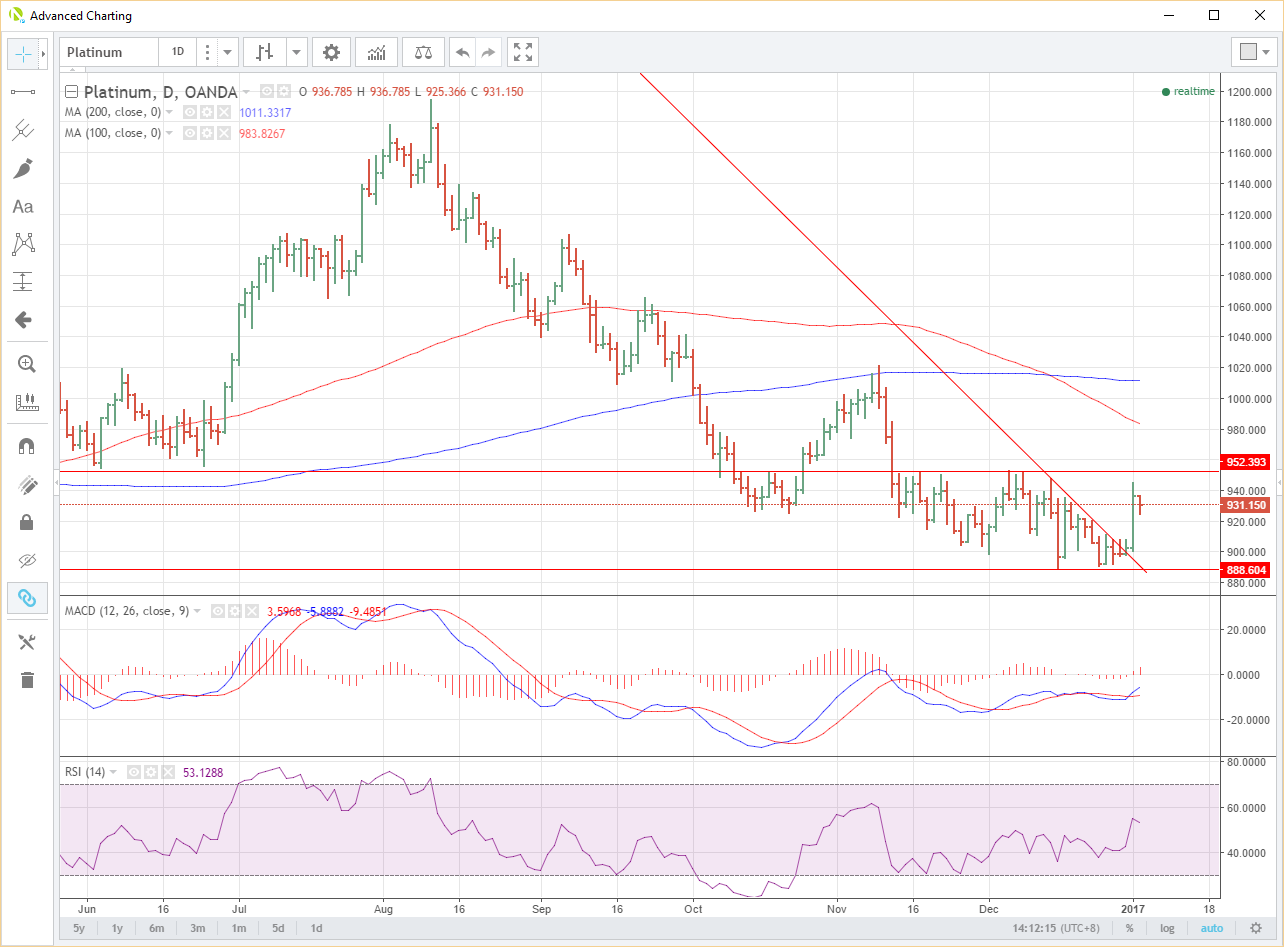
Platinum Daily
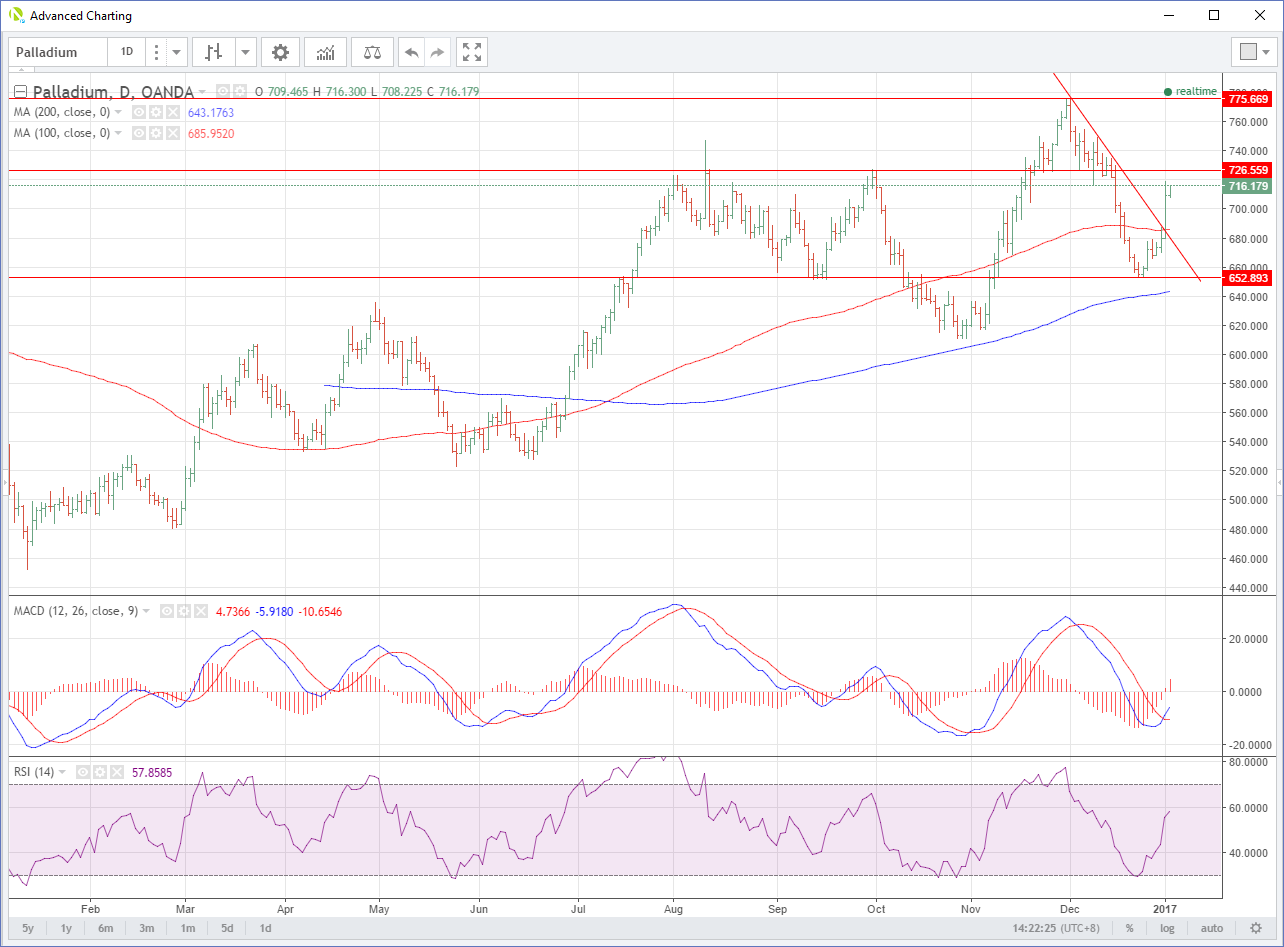
PALLADIUM
Platinum’s much more industrial little brother perversely had the best rally of all the precious metals percentage wise. Jumping $40 an ounce yesterday.
Having broken its recent downtrend line as well, this level at 685.9450, also the 100-day moving average, becomes support. This is followed by the recent lows at the 652.80/653.00 area and then the 200-day moving average at 643.1750.
Resistance is less clear cut with multi-day congestion at 726.50 and then Decembers highs at 775.65.
Palladium Daily
Short-term price action has been constructive for precious metals as a group as the mighty dollar rolls over oil and the FX space. Whether this is a false dawn is too early to tell, but is certainly worthy of continued attention.
