Precious metals for the most part have reached their initial rebound targets. Gold has led the charge by pushing above $1140 to $1150/oz resistance (for now) while Silver rebounded back to former support (the mid $15s). Market Vectors Junior Gold Miners ETF (NYSE:GDXJ) has nearly touched $23 but Market Vectors Gold Miners ETF (NYSE:GDX) has failed to touch $17. This leaves us to question how much upside could be left and what happens next.
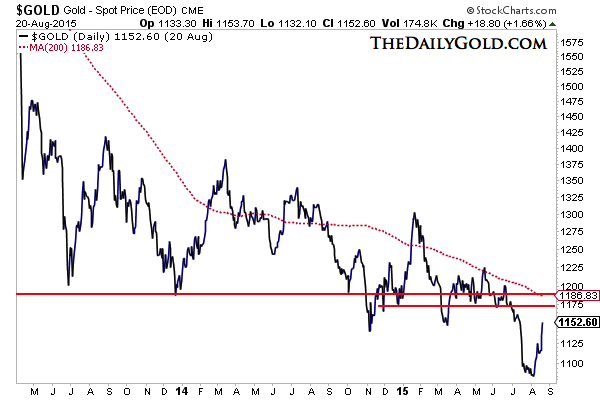
The daily line chart of Gold is shown below. It does not include Friday’s price action which had Gold trading at $1160/oz. Gold has been able to push above the $1140 to $1150 resistance area. On the monthly chart, $1180 is significant resistance. The 200-day moving average is at $1187 and declining. The next strong lateral resistance is $1175 which provided support many times over the past nine months. Gold traded as high as $1165 and figures to close the week around $1160. It has potential upside to $1175.

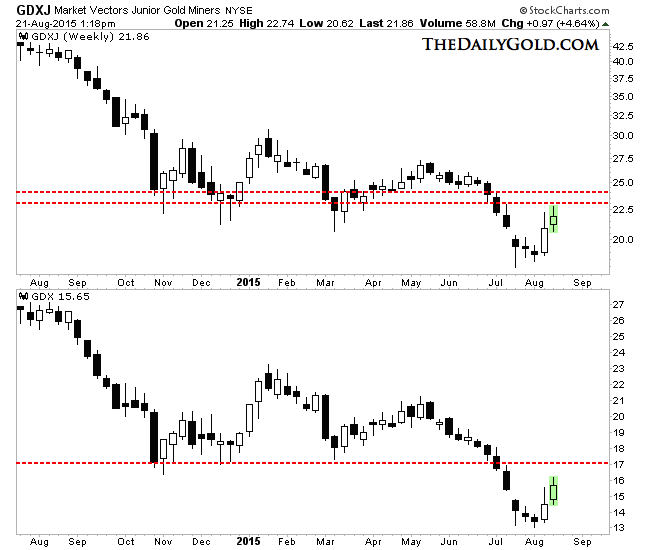
While Gold was higher on Friday, the gold miners put in a reversal on the daily chart. It could be a signal that the rebound is losing steam. The weekly candle charts of GDXJ and GDX remain fairly strong. Note that GDXJ came within 1% of $23 this morning. GDX has yet to reach $17 but is only down 1% today. If Gold is going to test $1175 then GDXJ could trade up to $24 while GDX touches $17.
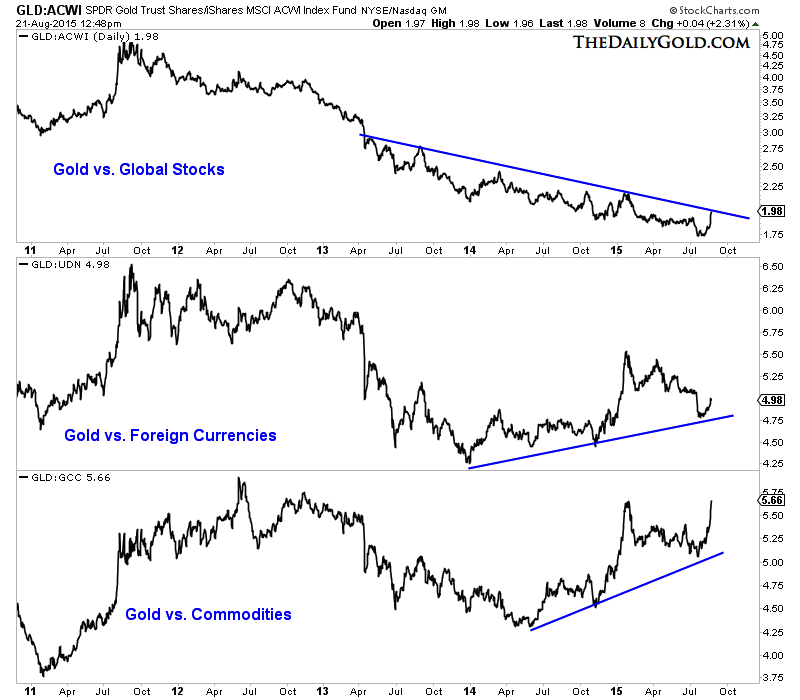
As the precious metals sector tries to find a bottom or establish a base, it will be very important to keep an eye on Gold’s relative performance which is often a leading indicator at key turning points. Below we plot Gold against stocks (iShares MSCI ACWI (NASDAQ:ACWI)), foreign currencies (PowerShares DB US Dollar Bearish (NYSE:UDN)) and commodities (GreenHaven Continuous Commodity Fund (NYSE:GCC)). Gold is strongest against commodities and weakest against stocks. Gold against foreign currencies bottomed almost two years ago. Gold needs to break its downtrend against stocks before a new bull market can take hold.
The cracking of the US equity market is definitely a positive for the precious metals sector but it does not tell us if the sector has bottomed. Gold has taken out $1150/oz for now and has potential upside to $1175. Given the strong overhead resistance we should expect a pullback or some consolidation of recent gains. Keep an eye on the miners as they tend to lead the metals. The reversal in the miners today is an early warning signal that the rebound could be nearing its end.
If Gold retreats and threatens to test $1000/oz then keep your eye on its relative performance against equities. Gold has already bottomed against foreign currencies and is showing strength against commodities. However, Gold has yet to overcome the broad equity market. A clear break in that downtrend in favor of Gold would be a powerful signal that a new bull market has already begun or is imminent.


