- Gold prices plunge as US data affirms a steady “taper”
- Crude Oil exposed to souring sentiment as US equities pullback
- Silver aiming at the $19.00 floor as bearish signals emerge
Gold and silver are extending their declines in early European trading following a dramatic drop on the back of better-than-anticipated US jobless claims figures on Thursday. The precious metals may be exposed to further declines on an upside to surprise to US consumer sentiment figures due in the session ahead. Meanwhile, the crude oil bears may be set to stage a return if the recent retreat in equities spills over to broad-based risk aversion.
Precious Metals Plunge On Firming US Data
Silver posted its largest single day percentage decline in almost a month alongside steep falls in gold, following a drop in jobless claims in the US to the lowest level in 7 years. The losses accelerated on a reported a rise in US year-on-year inflation to the highest level since July 2013. While it would likely take a more material uptick in inflation to cause Fed policy makers to express concern, a steady improvement in the labour market and continued rise in general prices may bolster expectations for an eventual rate hike, which would put further pressure on gold and silver.
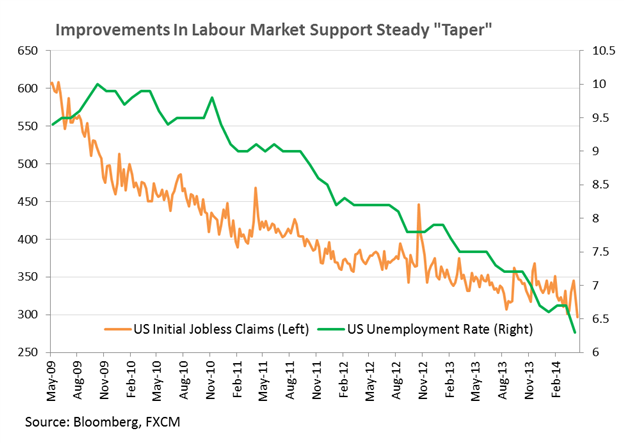
The University of Michigan Consumer Confidence data will be in focus for traders in the coming session, with economists tipping a rise to 84.5, which would be the highest figure since July 2013. A better-than-anticipated print from the leading indicator would help affirm the recovery in the world’s largest economy is on track, and may help alleviate concerns raised by the recent anemic first quarter growth reading.
Traders should pay additional consideration to the implications of waning geopolitical risks on the precious metals. Ongoing turmoil in Eastern Europe has fuelled safe-haven demand for the gold price over recent weeks. As news-flow surrounding the Ukrainian conflict fades from the headlines, the yellow metal may be vulnerable to a sell-off as traders unwind fear-driven positioning.
Crude Oil Exposed To Souring Sentiment
While recent commodities reports have generally focused on the supply and demand story for WTI prices, an undercurrent for the direction of crude oil is offered by general risk-appetite. The additional guidance offered by investor sentiment is made more noteworthy by the recent pullback in US equity benchmarks, which serve as a proxy for risk-trends. With technical indications suggesting the S&P500 selloff may be gaining momentum, and company valuations appearing a little lofty, a continued retreat may spill over into weakness for crude oil in the sessions ahead.
Crude Oil: Recovery Stalls At Nearby Resistance
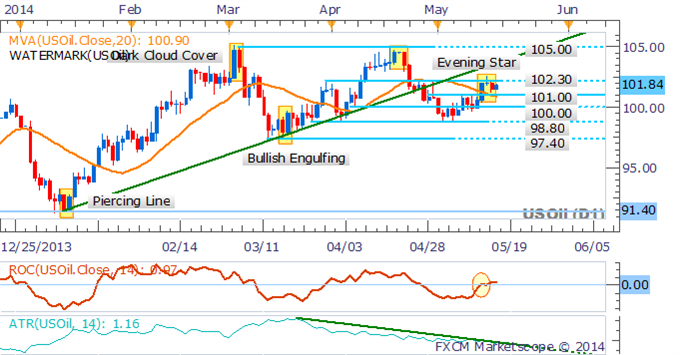
Sentiment may be shifting for crude oil following a failure to breach the 102.30 mark in recent trading. The formation of an Evening Star candlestick pattern near the resistance level suggests the bears may be looking to stage a return. However, with prices above the 20 SMA and a positive reading from the rate of change indicator a mixed technical bias is offered.
Gold: Dojis Highlight Trader Indecision
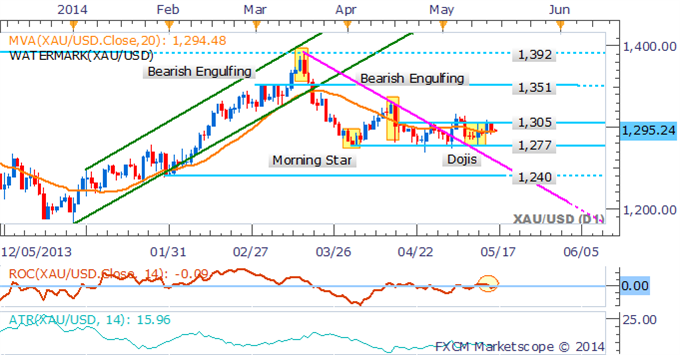
Several Doji formations on the daily suggest hesitation from the bears as gold teases at a push above critical resistance at $1,305. With volatility remaining low (as reflected on the ATR), the current environment may favor range-trading setups, which is further supported by a lack of momentum signaled by the Rate of Change indicator.
The DailyFX Speculative Sentiment Index suggests a mixed bias for gold based on trader positioning.
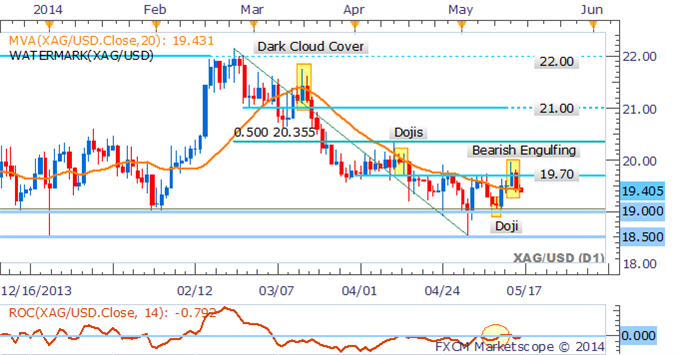
Silver: Eyes $19.00 Handle
Silver’s pullback overnight has resulted in the formation of a Bearish Engulfing pattern on the daily, which suggests the bears may be looking to push prices back to the $19.00 handle.
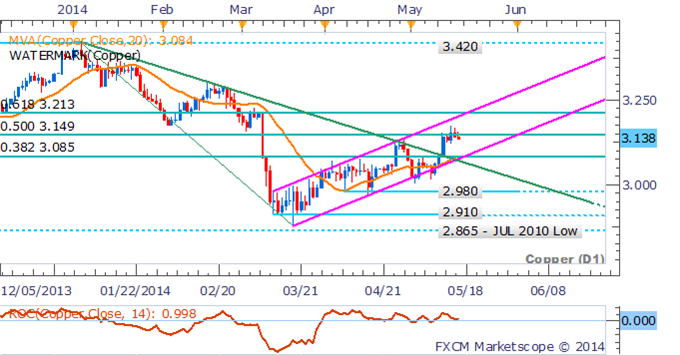
Copper: Bulls Lose Steam Near Fib Level
The copper bulls are showing signs of hesitation as prices stall near the 50% Fib Retracement level near $3.149. However, with the base metal still in a short-term uptrend and remaining within an ascending trend channel a bearish bias is precluded. At this stage a pullback to support at $3.085 would be seen as an opportunity to enter new long positions.
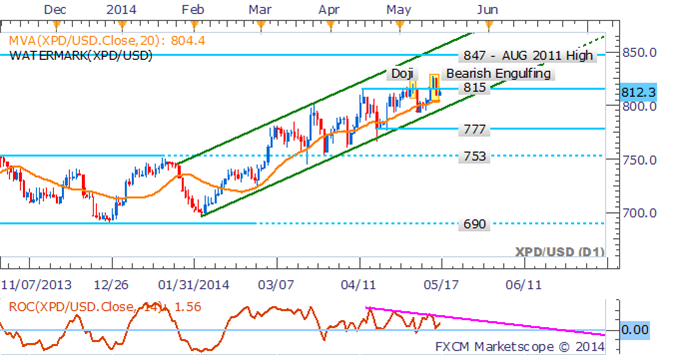
Palladium: Stages False Breakout As Prices Pullback
Palladium has staged a false breakout with prices pulling back below the $815 handle. While a Bearish Engulfing pattern has formed on the daily, it may find little follow-through, given that prices remain within an ascending trend channel. A test of the ascending trendline would be seen as an opportunity to enter new long positions.
Platinum: Bearish Pattern Awaits Confirmation
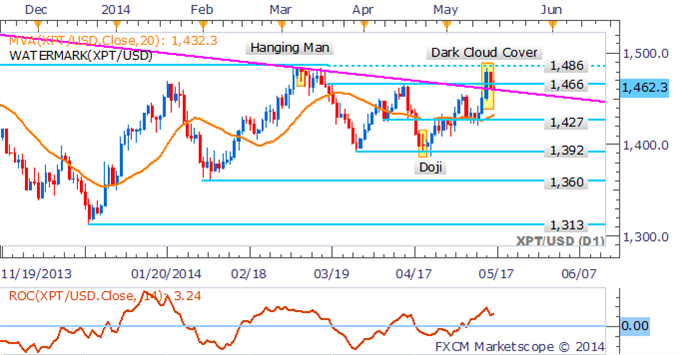
Platinum’s rally has been cut short just shy of its 2014 high near $1,486. While a Dark Cloud Cover pattern suggests a potential shift in sentiment, the formation needs to see confirmation from a successive down-day in order to be validated.
