Sector expert Michael Ballanger reviews recent movements in precious metals and discusses how he is playing the market.
Last week I sent out my uber-bullish call on the metals and miners at the conclusion of a period fraught with doom and despair for all things gold and silver. The criminality of the interventionists was in full bloom as they bombed gold down through that critical "Line in the Sand" at $1282 forcing the Speculative Longs (hedge funds, quant funds, technical funds) to immediately reverse and regurgitate longs and initiate big new short positions as the bullion bank behemoths took profits. First, let's revisit that missive.
From Saturday the 20th:
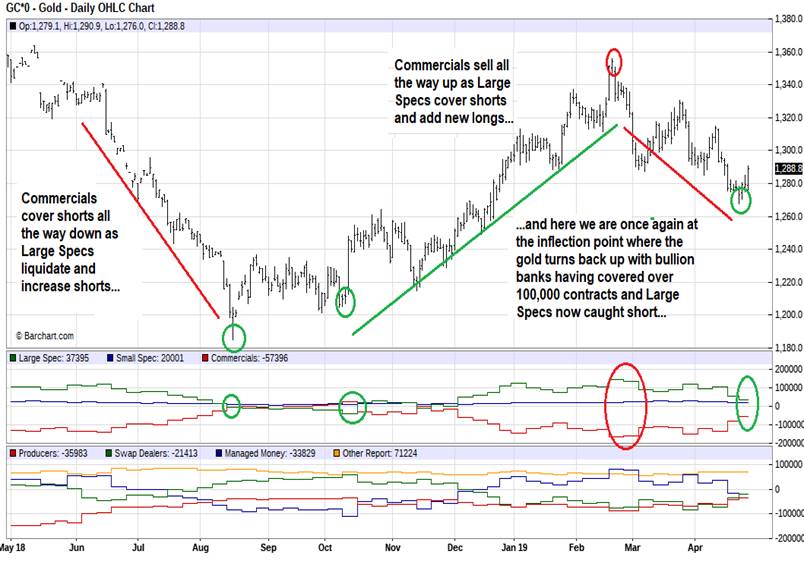
"All right, now that I have concluded my rant on the madness being inflicted upon us, I have a couple of observations to make about gold. Earlier last week, I was looking at GLD wondering whether my GLD May $124 puts might hit $5.00 before the end of the week and then it occurred to me that my "Line in the Sand" at the prior lows of $1,282 and the subsequent "breakDOWN" was no different in its blatancy than the "breakOUT" in Barrick. So, I pulled up the GLD chart and lo and behold, while the sub-30 level for RSI sported two super buying opportunities in 2018, it has not been much under 35 in all of 2019 thus far. Now, notwithstanding that the stock markets are getting somewhat stretched, I have to respect two things: 1) the dotted red line in the RSI window in the chart below and 2) that only in the perverse world of precious metals are technical "breakdowns" to be BOUGHT while technical "breakouts to be SOLD. Therefore, I have covered all my shorts in both gold and the mining shares and initiated 50% long positions in JNUG, NUGT and the GLD June $120 calls. The chart below pretty much says all that is needed; we are at an inflection point that represented tradeable bottoms in mid-November and early March."
After a particularly heavy reading day on Sunday, I let loose with this unhedged, categorically table-pounding bullish call:
Monday, April 22, 2019 (after the close)
Buy gold; buy the Gold Miner ETF's…
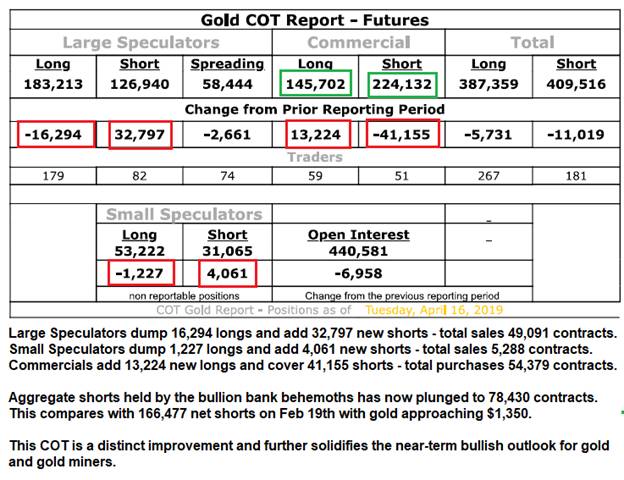
"Just a short note this afternoon to bring attention to the Gold Miners (HUI) that are under siege again today despite some sharp improvements in the COT, which came out on Good Friday while I was enjoying the Easter weekend and the NHL playoffs. It was a decisively bullish report with the Commercial cretins covering 54,379 contracts. They let out a lot of line in February at $1,340-1,350 and are now booking the approximately $75/ounce of gains which amounts to approximately USD$660,352,500 in profits which is pretty nice work if you can find it, especially with regulators turning one blind eye while they wink the other.
Also bullish is the chart of the GLD posted Saturday as it has entered oversold status. Everyone is now resigned to a test of the 200-dma at $118.25 ($1,152 for gold) but I don't think it will get there without at least a $30 rally first."

-End of Monday Re-post-
The next morning, gold traded down to $1,267.90, marking the low for the move along with similar bottoms for GLD (SPDR Gold Shares (NYSE:GLD)), SLV (iShares Silver Trust (NYSE:SLV)), NUGT (Direxion Daily Gold Miners Bull 3X Shares ) and the JNUG (Direxion Daily Junior Sold Miners Bull 3X Shares) and all my favorite leveraged longs for metals and miners have rocketed straight north ever since. Once again, this is not so much intended as a self-laudatory indulgence but more as a revolting illustration of the foul machinations of the bullion banks. What they are allowed to do with the paper markets is analogous to robbing a Brink's truck en route to Fort Knox.
In the "You have GOT to be joking" category, once again, thanks to the blind eye of the regulators and the criminal complicity of the CFTC, the bullion bank traders manipulated the gold market through coordinated Crimex opening bombings to create a pervasive aura of fear and loathing such that the $1,282 level was taken out with a vengeance on April 16th with the $1,267.90 lows coming exactly one week later and precisely at the conclusion of the April 23rd COT week. You read it here late that week when I concluded that the $1,282 "breakdown" would be a sucker shot (failed breakdown), which resulted in last Saturday's missive. By that Tuesday, every algobot and armchair technician was targeting and typing "200-day moving average @ $1,252" but as we now look back, the bullion bank Cretins created the signal through intervention and then with the "breakdown" pattern in place, ambushed the Large and Small Spec sellers/shorters by engaging in massive short covering, which halted the descent and set up the late-week rally—and the COT Report spells it out by their actions right up to the day I went 100% long. See below…
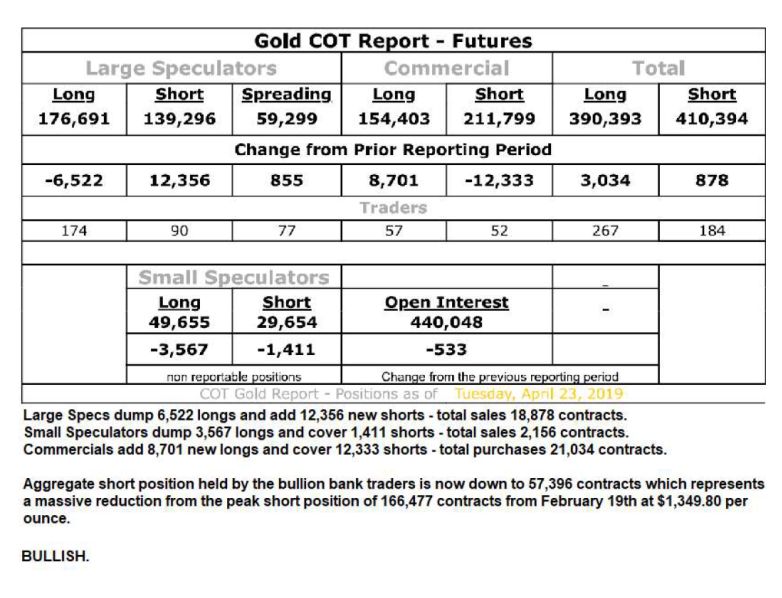
COT
Could it be any more blatant than the tape action in gold late last week? If you took the chart of gold and removed all the text so all that was shown were just the numbers and candles, the penetration of $1,282 was a classic, textbook sell signal and price should have proceeded to test the 200-dma at $1,252. If that was a stock chart and price action made such a move, you get bet the freaking farm that there would be a "WHOOSH" of selling with price responding normally. However, since this is the precious metals market and since gold represents a "Clear and Present Danger" to the health, safety, and security of the American Dream, it is managed by the central banks and treasury department desks in all countries subservient to U.S. hegemony. That is, quite simply, why it trades so abnormally and why I throw all technical analysis rules into the waste bin and have been doing so for as long as you can all remember.
Now that I am now comfortably long the JNUG at prices of $7.15 and $7.86 for an average of $7.505 with the stock now trading at $8.24, I am placing stop-losses accordingly so as to protect the gains. I bought the GLD June $120 calls at $2.06 last Friday and they are currently $2.75. I bought a 50% position in the NUGT June $15 @ prices of $3.35 (Thursday April 18th) and then Tuesday June 22nd I added another 50% at $2.35 averaging $2.85 with the market at $2.82. (I was a tad early on NUGT).
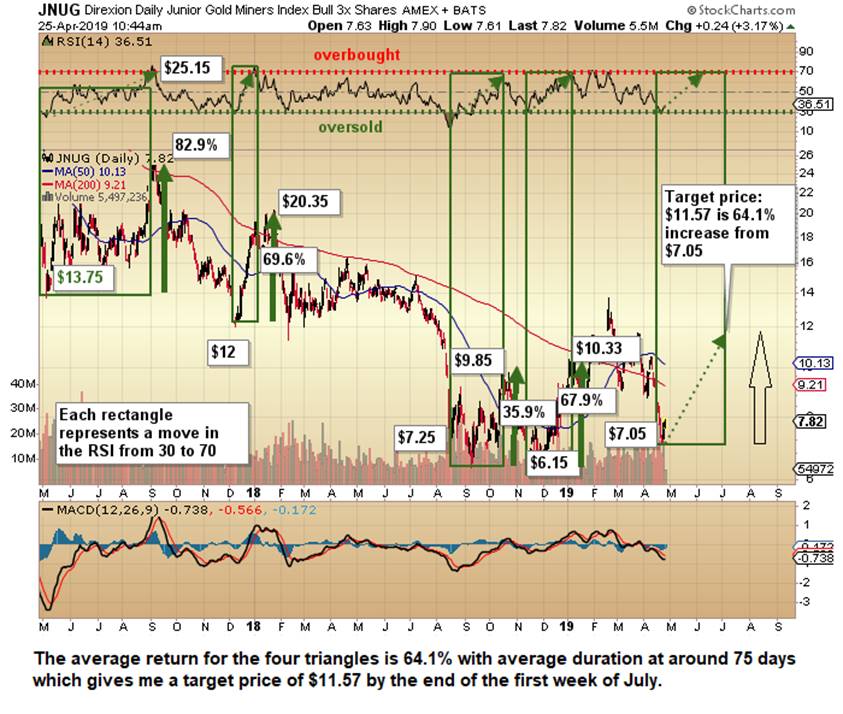
Lastly, here is an interesting exercise for the JNUG. I have been using the RSI swings between 30 and 70 as buy-sell guidelines; they have occurred four times in the past eighteen months with the average gain being 64.1 % and with average duration roughly seventy-five days. If I take the $7.05 low from Tuesday and use April 22nd as the bottoming date, I have a target price of $11.57 by the end of the first week of July. I am doing similar analyses for GLD, SLV and the NUGT and will advise.
So, here we are once again on the long side of the gold market having exited all leveraged positions first on February 20th at $1,348.80 and then again in late March at $1,320. I have a hunch that we may see a move to north of $1,315 during this move but until the U.S. dollar rolls over, the headwinds are going to be a tad too stiff to allow the ultimate ascent into the $1,400s and beyond. As I wrote last Saturday, I no longer agree to don the uniform of the masochist gold bug while the rest of the co-conspirators revel in the wonderment of orchestrated and colluded stock market advances. I instead am open to any and all methods of securing profitability in this bizarro trading world and if that includes thinking, acting and investing like a bullion bank thief, so be it.