In this article, we are going to explain and show you an interesting pattern that has been slowly forming over the past year in the precious metals sector. This pattern along with our analysis point to a significant rally to start in the next 4 months for gold, silver, platinum, palladium, and miners.
Before we get into the details, below, it is important for every trader to step back and look at the bigger picture. It’s way too easy to get sucked into the markets movements, become an emotional trader, start losing a few trades, and second-guessing your open positions.
These past 30 trading days have been really tough to trade because the market is chopping around with huge one day moves back to back. Sometimes, its best to sit, watch and wait for some dust to settle before getting overly involved with new trades which is what we have done. Recently we traded YANG for a quick 8% profit, then we closed out two trades in TNA to profit 10.1%, then another 17.7% this month. Other than that, that’s about it. Now, with that said, things are about to get really exciting for us traders and we are getting ready for some new trades, both short-term and longer-term, looking forward many weeks and where the market should be headed.
Enough about all that emotional stuff, let’s jump right into the charts so you can see what we are excited about in this post!
Weekly Custom Precious Metals Weekly Chart
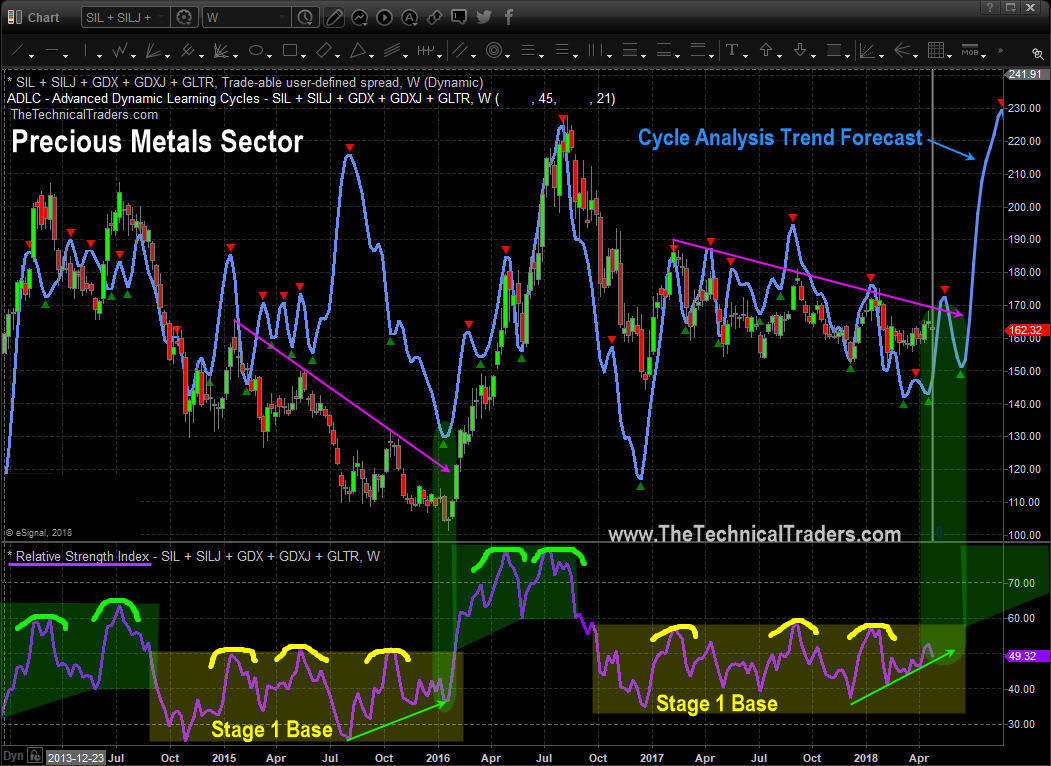
The chart below shows several interesting data points and it’s fairly easy to see and understand.
Starting at the bottom of the chart you will see the purple line which is the Relative Strength Index (RSI). If we look back 4 years you can see a similar pattern unfolding which leads to a massive rally for precious metals back in 2016.
Knowing human behavior patterns don’t change, but rather repeat, it is likely we see another upside breakout and rally later this year. That does not mean, the price will go straight up, it simply means on average over time we should expect higher prices.
Before any new rally can take place, the precious metals sector must breakout above the pink falling trend line, just as it did in 2016.
If you didn’t notice already, we have posted our weekly cycle analysis for the precious metals complex. Over the next 6 – 8 weeks the sector should start to rally and try to break out. Again, this does not mean everything in the precious metals sector will rise. In fact, there are a couple areas you will want to stay away from. We share the best trade setups and alerts with our subscribers as they occur.

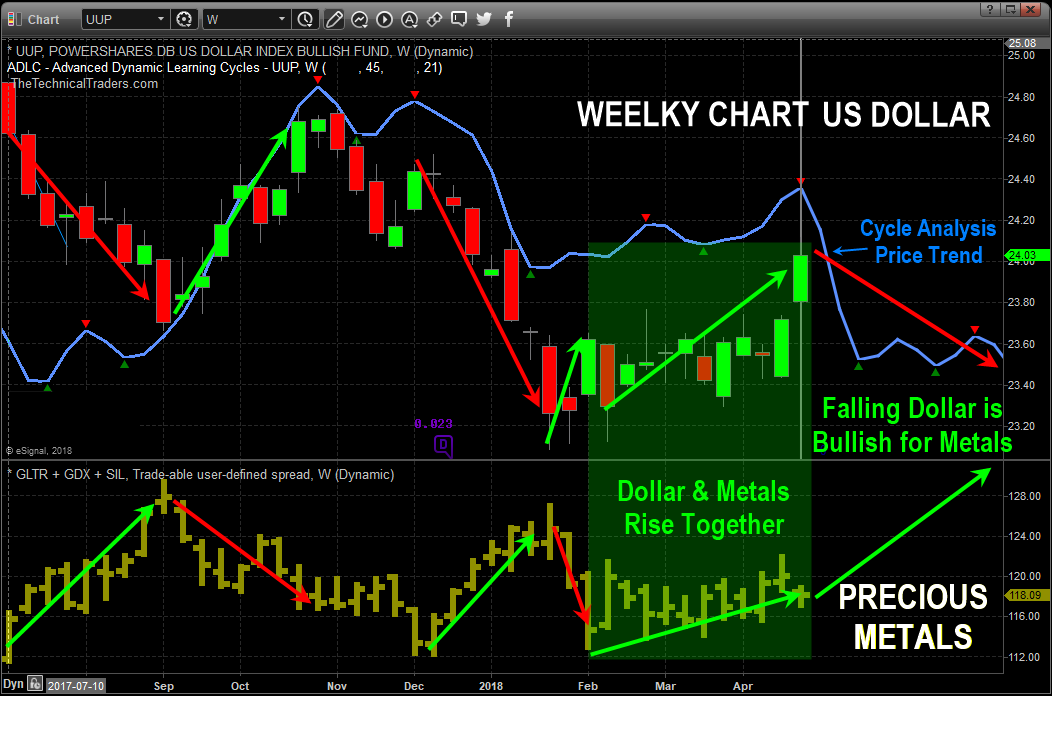
Weekly US Dollar and Precious Metals Comparison Chart
Here we show you on the chart the basic concept of how a falling dollar will push the price of gold higher, and how a rising dollar pulls metals lower on average. But this is not always the case. In fact, recent price action shows the dollar moving sharply higher while the precious metals sector moved sideways and higher. This looks like bullish divergence from their normal correlation and is likely caused by different global market dynamics injecting some new level of a fear that is funneling money into gold as a global safe haven.

Concluding Thoughts:
In short, we have been talking about the new bull market slowly setting up for precious metals since late 2017. As an investor and trader its always nice to be able to look forward knowing with a high probability what asset classes should be moving in and out of favor so we can position our capital accordingly.
If our analysis is correct once again, then over the next couple months this sector should be testing critical resistance to breakout and rally above the pink trend line.
