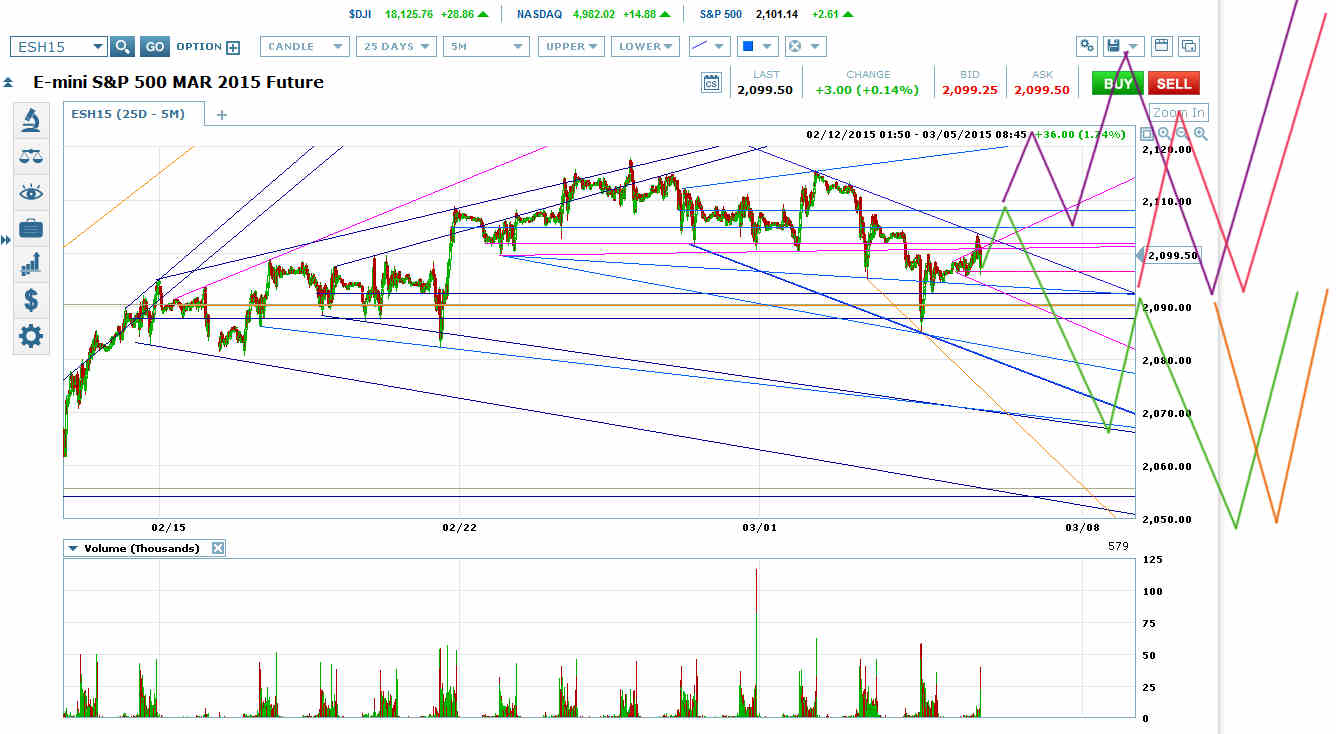
Failure of a Potential Major Bearish Set-Up
ES failed to turn at the top of yesterday’s potential little silver price channel. When that channel failed, it was the failure of a major potential bearish set-up.
Now ES has put in a little retrace from the top of a larger potential price channel (bright blue on chart) on incredibly low volume. There is nothing real behind that turn. That’s just the market-making bots jerking everybody around.
There’s a new little pink megaphone on the chart that I fully expect to kill that blue price channel. There’s a collapsed SPDR (ARCA:SPY) put-call ratio, but the open interest is so low that it’s unlikely to have a huge effect.
Megaphones
ES has essentially worked its way to a multi-megaphone VWAP area to wait for the NFP report.
The largest megaphones on the chart above go back to late January. The second largest megaphone required a retrace to VWAP before it was legal for a breakout upwards. It got that VWAP retest yesterday, and has bounced off of it.
That means the two largest megaphones in the chart above are now legal for a breakout upwards. ES could just go up and keep moving, with the only required retraces being small ones for littler interior megaphones.
But ES could still complete the trip to the megaphone bottoms before returning to at least right around here. Then they could reverse here for a downward breakout, or more likely move up through this level to a new high.
Head and Shoulders
There’s an obvious complex head and shoulders on the chart. But there’s no way it can break out like a real head and shoulders because of the megaphones on the chart.
The megaphones could possibly break out downwards, but only after stopping out everyone who tries to bet the head and shoulders breakout.
There are two things that make it highly likely that this head and shoulders is a fake and will be leading to a new high. The first is all the interior megaphones on the chart above. Real major head and shoulders tops aren’t filled with endless interior megaphones. I’ll try to put together a post with lots of charts showing real head and shoulders patterns so you can see the difference.
In a real head and shoulders, there’s a strong plunge before the head. That reflects sellers losing control–the market got away from them.
Then the head is a strong move up on strong bullish sentiment. (If you don’t get that strong move up, there’s nobody to run over to create the proper collapse on the breakout through the neckline.)
The right shoulder tends to be either fast, with straight shots in both directions, or a triangle, with the moves inside the triangle getting faster as disciplined sellers get to a panic level.
This head and shoulders is instead comprised of literally dozens of megaphones inside other megaphones within larger containing megaphones. Every interior megaphone has spun off other interior megaphones. There is no reversal momentum at all behind this head and shoulders. Megaphones inside megaphones inside megaphones don’t reflect major selling. They reflect waiting.
The second thing that makes this head and shoulders likely a fake is its price channel context.
3-Year Price Channel
There’s an obvious 3-year price channel on the ES and SPY charts. If ES breaks out downwards from the megaphones on the chart above, it will be heading for the channel bottom after an exact touch on the channel top on November 21. The exact touch was not at the high, but that doesn’t matter.
It’s little-guy selling that turns prices on exact lines. You don’t get important sell-offs on little-guy selling.
That price channel is in its critical decision wave. Either ES pierces that channel top to set up a breakout into a steeper channel, or it is supposed to fail to reach that channel top to either start a topping pattern or set up a roll into a less steep channel.
I think ES will break that channel top, and then we’ll see.
Potential Short-Term Set-Ups
If the blue price channel top actually holds here, and ES puts in a new low within that channel, there would be two potential set-ups.
A partial retrace into the channel from the bottom that then breaks out downwards would be a set-up to short into a possible melt-down.
If instead the blue price channel puts in a lower low, and then breaks out the top, you’d expect a classic E-waver Fibonacci retrace off the move from the high to the channel low. Then you’d expect a hard fast C wave down.
Another set-up is the green scenario in the chart above. If ES destroys the blue price channel here with a move through the top, then reenters the channel, it’s a set-up to bet to a lower low and probably a set of lower lows.
If instead ES gets moving up through 2108, it’s headed for a megaphone top. I’ll post targets if it happens.
