PPG Industries (PPG) Beats Q4 Earnings & Sales Estimates

Published 01/17/2018, 09:50 PM
Updated 10/23/2024, 11:45 AM
PPG Industries Inc. (NYSE:PPG) reported net earnings from continuing operations of $184 million or 72 cents per share for fourth-quarter 2017, a roughly two-fold increase from the year ago figure of $91 million or 34 cents. However, adjusted earnings were $1.19 per share that surpassed the Zacks Consensus Estimate of $1.18.
Net sales increased 7.8% year over year to $3,682 million, beating the Zacks Consensus Estimate of $3,605 million. Favorable currency swings positively impacted net sales by more than 3%.
FY17 Results
For full-year 2017, the company posted profits from continuing operations of $1.4 billion, or $5.46 per share, up from $547 million, or $2.05 per share, reported in 2016. Adjusted earnings for the year came in at $5.87 per share, up 3.5% from $5.67 reported a year ago.
PPG Industries reported revenues of $14.8 billion in 2017, up around 3.4% from $14.3 billion reported in 2016. While favorable foreign currency translation positively impacted sales by less than 1% and acquisitions related sales improved more than 1%.

PPG Industries, Inc. Price, Consensus and EPS Surprise

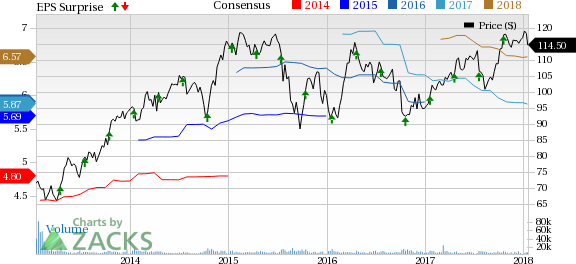
PPG Industries, Inc. Price, Consensus and EPS Surprise | PPG Industries, Inc. Quote

Segment Review

Performance Coatings: The segment recorded $2.1 billion in sales and income of $260 million in the fourth quarter. Sales grew 7.3% year over year. Favorable currency translation increased segment sales by more than 3%.

Segment income rose 8.8% year over year driven by the impact of increased sales volumes, overhead and manufacturing cost management and better selling prices, partly offset by significant raw material inflation. Architectural coatings — America and Asia Pacific sales volumes increased by low single-digit clip year over year. Protective and marine coatings sales volumes were flat year over year

Industrial Coatings: Sales at the segment were $1.6 billion, up roughly 8.4% from the prior-year period. Total sales volume rose by more than 4%. Acquisition-related sales provided benefits of $27 million.

Net income at the segment was $212 million, down 10.2% year over year as cost improvements and strong sales volume gains was offset by significant raw material inflation and slightly reduced selling price. Favorable currency swings increased segment income by $6 million.

Financial Position

PPG Industries ended 2017 with cash and cash equivalents of $1,436 million, down 21.1% year over year. Long-term debt rose 9.2% year over year to $4,134 million.

Outlook

PPG Industries anticipates additional selling price increases this year. The company is committed towards deploying at least $2.4 billion of cash in 2018 backed by acquisitions and share repurchases as part of its earlier communicated goal of deploying $3.5 billion in 2017 and 2018 combined. The company expects its effective tax rate to be in the range of 23-24% for 2018.
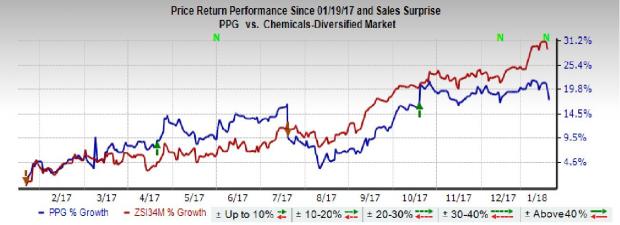
Price Performance

PPG Industries has underperformed the industry over the past year. The company’s shares have moved up around 17.4% compared with roughly 29.2% gain recorded by the industry.

Zacks Rank & Stocks to Consider
PPG Industries carries a Zacks Rank #3 (Hold).
Some better-ranked stocks in the basic materials space are Kronos Worldwide Inc. (NYSE:KRO) , Methanex Corporation (NASDAQ:MEOH) and Huntsman Corporation (NYSE:HUN) all sporting a Zacks Rank #1 (Strong Buy). You can see the complete list of today’s Zacks #1 Rank stocks here.
Kronos Worldwide has an expected long-term earnings growth of 5%. Its shares skyrocketed 123.8% over a year.
Methanex has an expected long-term earnings growth of 15%. Shares of the company rallied 32% in a year.
Huntsman has an expected long-term earnings growth of 8%. Its shares soared 73.8% over a year.
Zacks Top 10 Stocks for 2018
In addition to the stocks discussed above, would you like to know about our 10 finest buy-and-hold tickers for the entirety of 2018?
Last year's 2017 Zacks Top 10 Stocks portfolio produced double-digit winners, including FMC Corp (NYSE:FMC). and VMware which racked up stellar gains of +67.9% and +61%. Now a brand-new portfolio has been handpicked from over 4,000 companies covered by the Zacks Rank. Don’t miss your chance to get in on these long-term buys.


PPG Industries, Inc. (PPG): Free Stock Analysis Report

Methanex Corporation (MEOH): Free Stock Analysis Report

Kronos Worldwide Inc (KRO): Free Stock Analysis Report

Huntsman Corporation (HUN): Free Stock Analysis Report

Original post

Latest comments

Loading next article…
Risk Disclosure: Trading in financial instruments and/or cryptocurrencies involves high risks including the risk of losing some, or all, of your investment amount, and may not be suitable for all investors. Prices of cryptocurrencies are extremely volatile and may be affected by external factors such as financial, regulatory or political events. Trading on margin increases the financial risks.
Before deciding to trade in financial instrument or cryptocurrencies you should be fully informed of the risks and costs associated with trading the financial markets, carefully consider your investment objectives, level of experience, and risk appetite, and seek professional advice where needed.
Fusion Media would like to remind you that the data contained in this website is not necessarily real-time nor accurate. The data and prices on the website are not necessarily provided by any market or exchange, but may be provided by market makers, and so prices may not be accurate and may differ from the actual price at any given market, meaning prices are indicative and not appropriate for trading purposes. Fusion Media and any provider of the data contained in this website will not accept liability for any loss or damage as a result of your trading, or your reliance on the information contained within this website.
It is prohibited to use, store, reproduce, display, modify, transmit or distribute the data contained in this website without the explicit prior written permission of Fusion Media and/or the data provider. All intellectual property rights are reserved by the providers and/or the exchange providing the data contained in this website.
Fusion Media may be compensated by the advertisers that appear on the website, based on your interaction with the advertisements or advertisers.
© 2007-2025 - Fusion Media Limited. All Rights Reserved.