NVDA Q3 Earnings Alert: Why our AI stock picker is still holding Nvidia stockRead More

Gold Leads The Relationship Between XLE And GLD

Published 05/26/2016, 08:25 AM
Updated 05/14/2017, 06:45 AM
XAU/USD
-
GC
-
GLD
-
XLE
-

A mountain formed of an immense block of hard stone. A symbol of longevity and strength. One special kind of stone, gold, adds another dimension to that wealth. But even the strongest environment can give way to the wondrous power of nature.

This battle is playing out in the stock market as well. The chart below shows the ratio of the Energy ETF (NYSE:XLE) compared to the Gold ETF (NYSE:GLD). Gold has been in charge of this relationship for 2 years. The ratio has drifted lower over that timeframe.
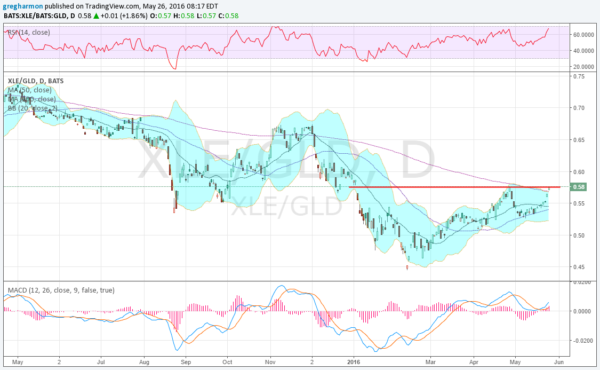
XLE-GLD Daily Chart

But 2016 may be changing that. Since finding a bottom in February the ratio moved higher. It filled the gap from the start of the year at the end of April and pulled back. But it was a shallow pullback that has now retraced and moved back to that prior high. The price action forms a Cup and Handle pattern. A continuation higher would give a target of 0.71 in the ratio.

But the ratio has been in similar situations before. By this I mean the move over teh 200 day SMA. Wednesday took the ratio back over the 200 day SMA for the first time since December. Back then it could not create any separation with the smoothing mechanism. And it could not do so in May of 2015 either. In fact the ratio has had only a few brief stints over the 200 day SMA since it first crossed under it in October 2014.

Will it continue or fail this time? It has momentum on its side to continue. The RSI is bullish and rising and the MACD is crossed up and moving higher. But it also has moved out of the Bollinger Bands®. This is a short term overbought condition. Watch how this plays out, but for now Power has the upper hand over Rocks.

DISCLAIMER: The information in this blog post represents my own opinions and does not contain a recommendation for any particular security or investment. I or my affiliates may hold positions or other interests in securities mentioned in the Blog, please see my Disclaimer page for my full disclaimer.

Original post

Latest comments

Loading next article…
Risk Disclosure: Trading in financial instruments and/or cryptocurrencies involves high risks including the risk of losing some, or all, of your investment amount, and may not be suitable for all investors. Prices of cryptocurrencies are extremely volatile and may be affected by external factors such as financial, regulatory or political events. Trading on margin increases the financial risks.
Before deciding to trade in financial instrument or cryptocurrencies you should be fully informed of the risks and costs associated with trading the financial markets, carefully consider your investment objectives, level of experience, and risk appetite, and seek professional advice where needed.
Fusion Media would like to remind you that the data contained in this website is not necessarily real-time nor accurate. The data and prices on the website are not necessarily provided by any market or exchange, but may be provided by market makers, and so prices may not be accurate and may differ from the actual price at any given market, meaning prices are indicative and not appropriate for trading purposes. Fusion Media and any provider of the data contained in this website will not accept liability for any loss or damage as a result of your trading, or your reliance on the information contained within this website.
It is prohibited to use, store, reproduce, display, modify, transmit or distribute the data contained in this website without the explicit prior written permission of Fusion Media and/or the data provider. All intellectual property rights are reserved by the providers and/or the exchange providing the data contained in this website.
Fusion Media may be compensated by the advertisers that appear on the website, based on your interaction with the advertisements or advertisers.
© 2007-2024 - Fusion Media Limited. All Rights Reserved.