You may already be aware of a term I use called “Power of the Pattern”. This phrase describes both the belief I have about investing and that the work I produce for you as a follower or subscriber to my research.
Power of the Pattern
Patterns are found all around us. The images at the top of this piece shows unique patterns in nature. I believe patterns can help us with investment decisions, so much so that I’ve devoted the last 20+ years of my life to finding patterns in charts to help people improve decision-making and results.
Patterns in charts are formed by price and time. But patterns are more than just lines on a chart. Patterns represent the accumulated decisions and beliefs of every investor in a particular asset; In addition, the type of patterns we find can help determine both direction & probability of future price action.
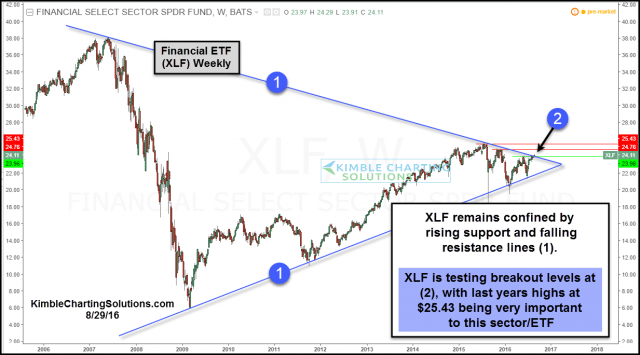
Below is Power of the Pattern applied to Financial Select Sector SPDR (NYSE:XLF).
The pattern in the chart below is known as a pennant pattern, or a symmetrical (sideways) triangle. In this pattern price moves into a tighter and tighter range over time (lines (1) below rising support and falling resistance. This pattern suggests a 50/50 outcome. So we are best not to predict direction but wait until price shows you the direction.
The purpose here is not to discuss the financial sector or what may have caused a breakout that eventually took place, but rather to know that patterns exist and can alert us to pay attention and get ready to take action… This is what I do for our members every day.
To sum things up
The Power of the Pattern gives us a visual representation of what investors believe about an asset in the past, today and probability for future price action.
My job is to provide you will quality pattern analysis with high probability outcomes. Your job is to apply it to your specific money management or trading style and risk management objectives.
I hope you found this helpful and I’m more than happy to share more pattern examples like this in the future.

