
The sterling has been the main mover in a slow start of the week. But the amount of volatility is only going to get better from here on out, as the RBNZ policy meeting is just 24h away. Do you want to find out how the market appears to be positioning ahead of the event? How about understanding how cheap the yen remains vs beta currencies? All that and much more is covered in today's report.
Quick Take
The sterling received a boost in demand as the decision by Nigel Farrage’s Brexit Party not to contest against the Conservatives seats but to instead go after the Labour-held seats at the upcoming election on December 12, plays into the view that the prospects of a hung parliament may be less likely.
The Kiwi, as the market prepares for the RBNZ monetary policy decision on Wednesday, has been showing signs of a long accumulation campaign in the works as I elaborate in the chart insights section. The Swiss franc has followed in lockstep the positive performance of the New Zealand Dollar, even if the rise cannot really be attributed to any news in particular but rather flows-led. The euro managed to hold into a tight range, with demand flows, at a marginal level, benefiting the currency the moment that the GBP popped up midday in the UK. The US dollar amid sparse trading activity going through the books as the bond market was closed to commemorate the Veteran's Day, traded generally weaker. A similar story is observed when looking at the Aussie, attracting steady sell-side flows ever since last Friday's RBA SoMP, which offered little surprises nonetheless. The Canadian dollar saw sellers take back control of the intraday price action, with the currency also weighted by the correlation it exhibits with the USD, which traded weaker.

Narratives In Financial Markets
* The Information is gathered after scanning top publications including the FT, WSJ, Reuters, Bloomberg, ForexLive, Institutional Bank Research reports.
Slow moves in FX with some exceptions: It was a low-key affair in the Forex market, aside from the movements in the GBP and CHF, as the US and Canada markets were closed due to Veteran's day. With the US bond market not open for business, this could be reflected in the tepid flows around the USD, moving with sparse volatility.
Brexit party sends GBP higher: Without a doubt, the news that Nigel Farrage’s Brexit Party won’t contest the 317 seats won by the Conservatives at the last election was music to the ears of the GBP bulls. Farrage said they’ll go after the Labour-held seats at the upcoming election on December 12. The immediate interpretation by the market was to anticipate that the news makes it less likely for the UK to end up with a hung parliament or a worse outcome such as a Labour-led minority government.
Does it make a difference Farrage's announcement? Market research and data analytics firm YouGov, via Christ Curtis, does not think the news make that much of a difference: “I’m not sure this makes much difference at all. Whilst it will certainly help the Tories retain the seats it currently holds, the Brexit Party will still be standing in the seats the Conservative Party hopes to gain from Labour in order to secure a majority.”
UK GDP Q3 not that bad: The other piece of relevant news out of the UK came in the form of the Q3 preliminary GDP, which missed expectations marginally at +0.3% vs +0.4% q/q expected. The data offers some minimal comfort as it reflects the country managed to muddle through away from a recession even as the Brexit conundrum continues after more than 3 years. The total business investment came better than expected as did exports, which may reaffirm the ‘wait and see’ mode by the BOE.
HK violence may influence risk profile: Over the weekend, we’ve seen more chaotic scenes out of HK, even if the HK leader Carrie Lam won’t budge to the popular clamor as violence keeps escalating with a child declared dead after a police shooting incident. The leader said “the violence will not make government yield to pressure,'' adding that “the priority now is to end the violence and return the city to normal.” The more the protests continue, the more the Hang Seng index may come under the cosh, as seen yesterday after a 2.5% fall, which may depress the ‘risk on’ mood in Asia.
No changes in the 'risk on' profile: The divergence pointed yesterday between the elevated risk-weighted line (accounts for the S&P 500 and US 30-year bond yields) and the Japanese Yen index, still implies that the risk-sensitive currency remains pricey even if some weakness has ensued in the last 24h, as anticipated, to adjust its valuation.
Fed's Rosengren takes the stage: The policy-maker, who voted against the rate cut in Oct, spoke in Oslo, noting that the Fed is less likely to move into negative rates, adding that “the fact that rates are negative in Europe means we have less room to maneuver.” Feds Rosengren also said “nothing since the Oct meeting would change view the last cut was not needed.” The policy-maker remains bullish in the US economy by stating that “the US economy is in pretty good shape, GDP looks to be growing around potential.”
Recent Economic Indicators & Events Ahead
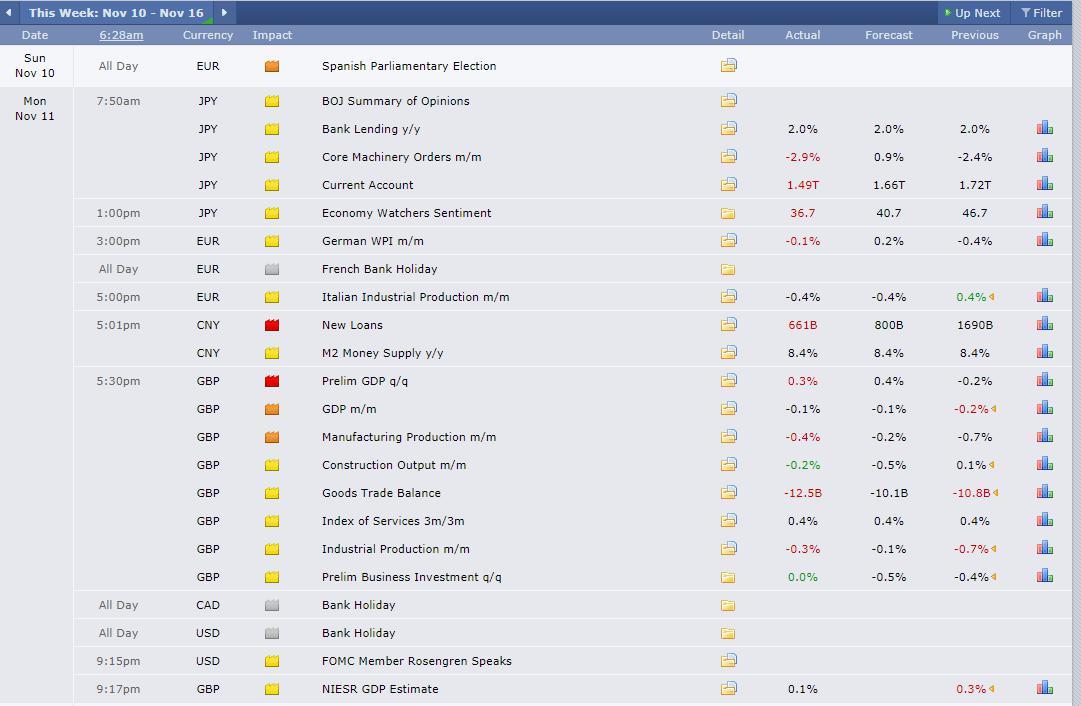
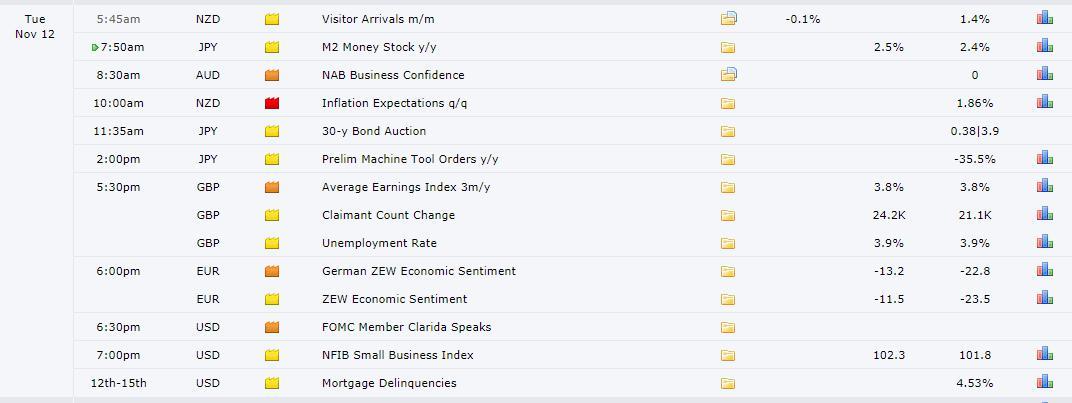
Source: Forexfactory
Professional Insights Into FX Charts
The way the Sterling has descended into an area of liquidity only to be rejected to such an extent that the structure of the market has now reverted, suggest that the order flow has shifted to the upside, and that makes me be a buy on dips earlier this week. The threshold location where prices to be paid to engage in the renewed bullish momentum are seen as acceptable would be from the 50% retracement, area where I look to engage. The upper circle highlighted in the chart is where I’d be looking to take profits as part of the plan.

A currency that will soon see an injection of strong volatility is the NZD. What this means is that ahead of it, the market has started to strategize plays to be filled at the most advantageous prices ahead of the risk event. It’s been my view that the market has gotten ahead of itself pricing in a rate cut by the RBNZ in tomorrow’s meeting. If we look at the price action in various NZD markets, with NZD/CAD one of my favorites, as here we have technicals and fundamentals telling us the same story, that is, the market is leaving breadcrumbs of its intention to go higher. Notice the last 3 legs lower compressed barely achieved new lows before a rejection? That’s characterized by a period of long accumulation, which occurs at the right timing ahead of the RBNZ, and tells us the market view is to position at the best cheap prices before a potential markup in price should the RBNZ decide to hold policy steady.

What follows is the commentary I wrote on the NZD/USD in my last piece
"This is more of a strategic/order flow/market structure trade idea to consider if you are inclined to believe the CB will keep the powder dry this week. Firstly, in terms of order flow, notice that the latest successful rotation to the upside in the 4h chart initiated in Oct 29 was impulsive vs the corrective pullback seen, which implies a constructive context to be buyers based on the conviction shown by each side and represented by the distance and speed the price traveled at. Secondly, the market is retesting an area of high liquidity where long-sided action to fill in long positions is a real possibility by the sector in the market that is looking to build a long campaign on the basis of a surprise hold on rates by the RBNZ, a possibility not to be dismissed."

AUD/JPY continues to exhibit a very clear divergence with the risk-weighted line, and as a result, I’d expect the current period of distribution in prices to eventually lead to a markup. The pair, sooner or later, must readjust to the improved risk profile depicted by the overlapping black line. Also note, the price has landed at an area where the last time traders exchanged hands at this location, there was an aggressive departure, giving us a very good reference as to the area where the market saw value to be a buyer the last time around. Ask yourself, if since that demand imbalance was formed, the risk dynamics are now improved, yet we are offered the same pricing, wouldn’t that represent value to be traded? Goes without saying, I am long AJ.

Important Footnotes
- Risk model: The fact that financial markets have become so intertwined and dynamic makes it essential to stay constantly in tune with market conditions and adapt to new environments. This prop model will assist you to gauge the context that you are trading so that you can significantly reduce the downside risks.
- Cycles: Markets evolve in cycles followed by a period of distribution and/or accumulation.
- POC: It refers to the point of control. It represents the areas of most interest by trading volume and should act as walls of bids/offers that may result in price reversals. The volume profile analysis tracks trading activity over a specified time period at specified price levels. The study reveals the constant evolution of the market auction process.
- Tick Volume: Price updates activity provides great insights into the actual buy or sell-side commitment to be engaged into a specific directional movement. Studies validate that price updates (tick volume) are highly correlated to actual traded volume, with the correlation being very high, when looking at hourly data.
- Horizontal Support/Resistance: Unlike levels of dynamic support or resistance or more subjective measurements such as Fibonacci retracements, pivot points, trendlines, or other forms of reactive areas, the horizontal lines of support and resistance are universal concepts used by the majority of market participants. It, therefore, makes the areas the most widely followed and relevant to monitor.
- Trendlines: Besides the horizontal lines, trendlines are helpful as a visual representation of the trend. The trendlines are drawn respecting a series of rules that determine the validation of a new cycle being created. Therefore, these trendline drawn in the chart hinge to a certain interpretation of market structures.
- Fundamentals: It’s important to highlight that the daily market outlook provided in this report is subject to the impact of the fundamental news. Any unexpected news may cause the price to behave erratically in the short term.
- Projection Targets: The usefulness of the 100% projection resides in the symmetry and harmonic relationships of market cycles. By drawing a 100% projection, you can anticipate the area in the chart where some type of pause and potential reversals in price is likely to occur, due to 1. The side in control of the cycle takes profits 2. Counter-trend positions are added by contrarian players 3. These are price points where limit orders are set by market-makers.