Investing.com’s stocks of the week

The 10-Year T-Note has already met all requirements for the retrace from the October 15 high.
Longer-term, there are two formations on the chart that suggest ZN will take out the October 15 high. But one is immediately bullish, while the other is short-term bearish before it gets bullish.
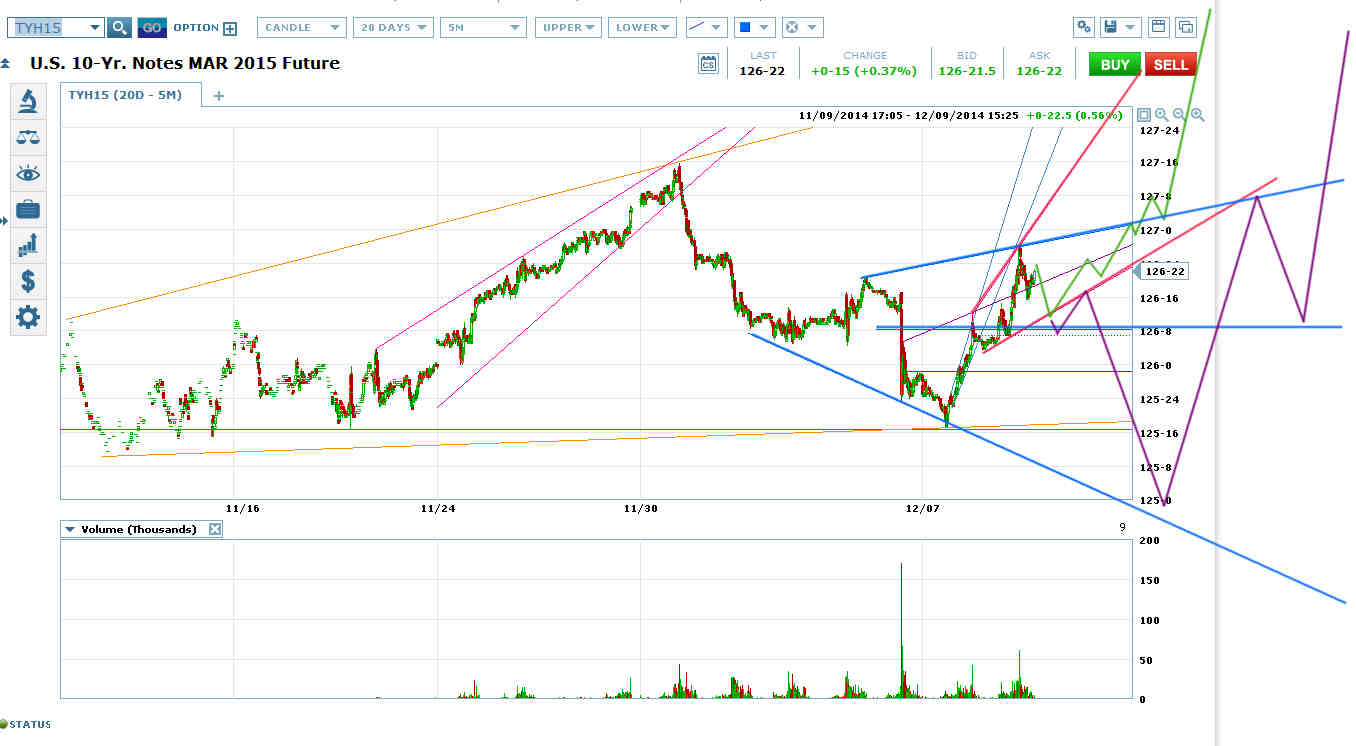
The immediately bullish formation is the red potential rising megaphone on the ZN chart. A retrace to roughly the bottom of that pattern would free up ZN for a melt-up to the formation top with a target higher than the October 15 high (green scenario). The final wave up in a rising megaphone is always a bubble wave. If we get that scenario, that’s a ride you want to be on.
The immediately bearish scenario requires the 10-year to take another trip to its bright blue megaphone bottom (the 10-year would probably reverse above the megaphone bottom guideline as drawn).
A trip to the blue megaphone bottom puts a megaphone right shoulder on the potential H&S on the ZN chart. A megaphone right shoulder is one of the surest signs of a fake head and shoulders.
Megaphone right shoulders almost always lead to a higher high that turns out to be the true head of the head and shoulders.
