Forex News and Events
Potential reflection point in US labor
The markets has been trading on the theory that weakness in labor report, specifically NFP, is an indication of a cyclical slowdown. However, yesterday JOLTs report throws a wrench in this theory. JOLTs total job openings increased to 5.788mn in April from 5.67mn in the prior month, a record high. An economic slowdown should be reflected in a decrease in job opening, however the reverse was realized. This could indicate that tightness in participation rate has thinned the pool of qualified applicants. If US labor markets have breached the non-accelerated inflation rate of unemployment (NAIRU) then the pace of wage growth should quicken as companies compete to outbid eachother for qualified candidates. Should the labor market data reflect weakness in the US economy then the Fed might hold back new hikes until 2017. However, should the issue be supply constraints then threat of inflation will push Fed rate hike expectations aggressively higher (which USD bears are not positioned for). Our view is that weakness in NFP is indicative of a broader slowdown, spreading from a strong USD and sluggish global demand. With Fed on the sidelines, BoJ preparing to stimulate further and ECB decidedly dovish, global loose momentary policy should encourage risk taking in high beta currencies. However, we remain vigilant for data indicating the alternative theory.
Oil gains support a Russian rate-cut cycle
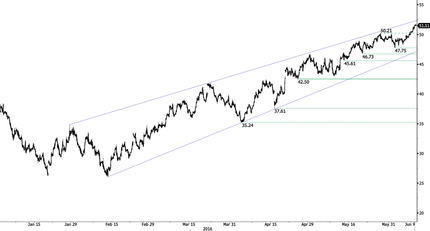
Oil prices have clearly bounced. The Brent price is now above $52 for a barrel, highest price since last October. The Russian economy is now taking a breath as its growth is clearly linked to its oil revenues. The ruble is then set to further strengthen which is something that the Russian government would like to avoid especially not to disrupt exports and future revenues. First quarter GDP of this year is nonetheless still negative at -1.2% y/y versus prior -3.8% y/y. Annualized revenues are still suffering from the last year slump in oil prices but should print way higher for the second quarter.
Tomorrow the Central Bank of Russia will decide about its key rate which is currently standing at 11%. We believe that the stabilizing ruble as well as the commodities price increase is underpinning a further rate cut by 25 basis points to 10.75%. In addition inflation has clearly slowed down with a recent print at 7.3% y/y which represents the lowest data since 2014. The differential between real rates and inflation is now broadening and we should see other rate cuts by the end of this year. In our forecasts, we target the Russian key rate to be lowered to under 10%. We are also bearish on the USD/RUB towards 60 on a more sustainable Russian recovery.

The Risk Today
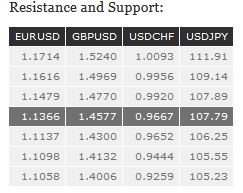
EUR/USD is still pushing higher. Hourly resistance can be found at 1.1479 (06/05/2016 high) and hourly support is given at 1.1326 (06/06/2016 low) and 1.1132 (03/06/2016 low). The technical structure suggests further increase toward resistance at 1.1479. In the longer term, the technical structure favours a very long-term bearish bias as resistance at 1.1714 (24/08/2015 high) holds. The pair is trading in range since the start of 2015. Strong support is given at 1.0458 (16/03/2015 low). However, the current technical structure since last December implies a gradual increase.
GBP/USD is trading mixed. Hourly resistance is given at 1.4660 (07/06/2016 high) and stronger resistance is located at 1.4770 (03/05/2016 high). Expected to show renewed bullish momentum toward resistance at 1.4770 as support at 1.4300 (21/04/2016 low) is not monitored and selling pressures seem slight. The long-term technical pattern is negative and favours a further decline towards key support at 1.3503 (23/01/2009 low), as long as prices remain below the resistance at 1.5340/64 (04/11/2015 low see also the 200 day moving average). However, the general oversold conditions and the recent pick-up in buying interest pave the way for a rebound.
USD/JPY's selling pressures continues despite slowing down. Hourly support can be found at 106.25 (04/05/2016 low while hourly resistance is given at 107.89 (intraday high). The medium term momentum is clearly oriented downwards. Expected to further weaken. We favour a long-term bearish bias. Support at 105.23 (15/10/2014 low) is on target. A gradual rise towards the major resistance at 135.15 (01/02/2002 high) seems now less likely. Another key support can be found at 105.23 (15/10/2014 low).
USD/CHF keeps on weakening. The pair has broken hourly support at 0.9652 (06/05/2016 low) and is now heading toward support at 0.9533 (04/05/2016 low) while hourly resistance can be found at 0.9783 (05/06/2016 high). Expected to show a continued bearish move. In the long-term, the pair is still trading in range since 2011 despite some turmoil when the SNB unpegged the CHF. Key support can be found 0.8986 (30/01/2015 low). The technical structure favours a long term bullish bias since last December.

