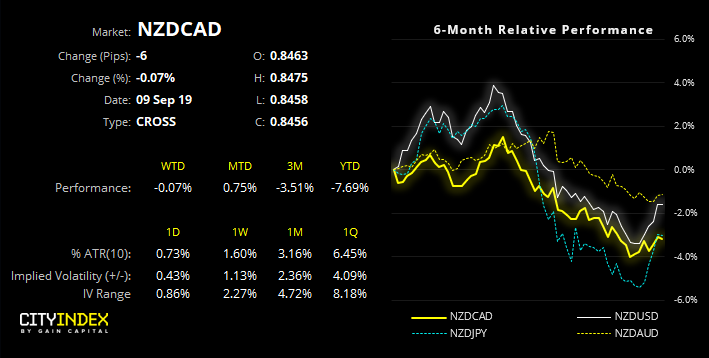
Potential Bear Flag Breakdown On NZD/CAD

Published 09/09/2019, 02:50 AM
NZD/CAD
-
NZDCAD Performance

NZD/CAD has been a trend that has kept on giving. We’ve been following its demise closely, since identifying its test of a long-term bearish trendline back in March, it’s double-top in April and potential 300-pip slide in June.
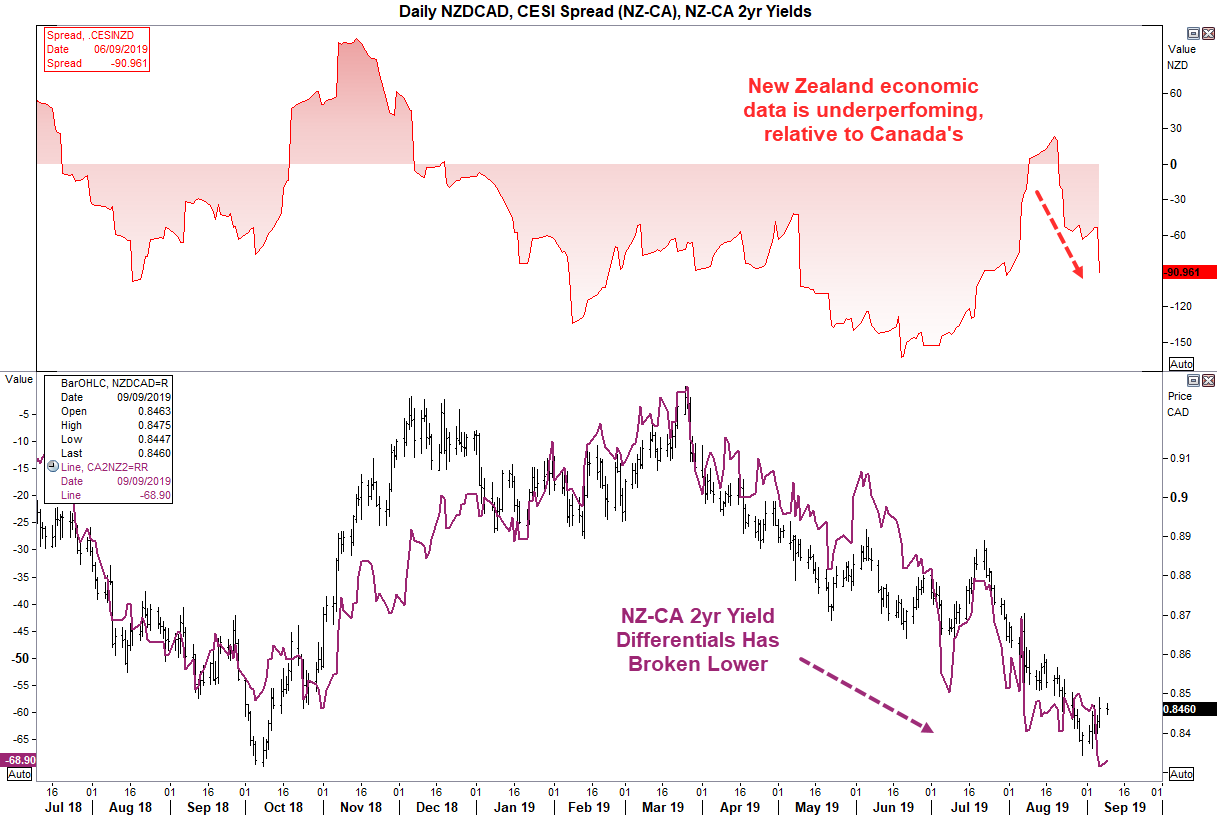
NZDCAD Daily Chart

After breaking below the 0.8500 target, the cross remains in an established bearish channel and shows the potential for a bear-flag on lower timeframes. Whilst the channel allows potential for a deeper correction against the dominant trend, we’d consider short setups if prices remain below 0.8500.

The daily trend structure remains firmly bearish, the CA-NZ 2yr yield differential has broken to new lows (ahead of price action) and, of course, Canadian dollar have the yield advantage with BOC’s base rate at 1.75% versus RBNZ’s 1%. Put together we suspect upside could be limited for NZD/CAD. Furthermore, we can see that Canada’s data is outperforming New Zealand’s, using the spread between NZ and CA CESI (City Economic Surprise Index).

For now, we’re watching to see how prices react around 0.8500, and the potential for a bear-flag breakdown.

Original Post

Latest comments

Loading next article…
Risk Disclosure: Trading in financial instruments and/or cryptocurrencies involves high risks including the risk of losing some, or all, of your investment amount, and may not be suitable for all investors. Prices of cryptocurrencies are extremely volatile and may be affected by external factors such as financial, regulatory or political events. Trading on margin increases the financial risks.
Before deciding to trade in financial instrument or cryptocurrencies you should be fully informed of the risks and costs associated with trading the financial markets, carefully consider your investment objectives, level of experience, and risk appetite, and seek professional advice where needed.
Fusion Media would like to remind you that the data contained in this website is not necessarily real-time nor accurate. The data and prices on the website are not necessarily provided by any market or exchange, but may be provided by market makers, and so prices may not be accurate and may differ from the actual price at any given market, meaning prices are indicative and not appropriate for trading purposes. Fusion Media and any provider of the data contained in this website will not accept liability for any loss or damage as a result of your trading, or your reliance on the information contained within this website.
It is prohibited to use, store, reproduce, display, modify, transmit or distribute the data contained in this website without the explicit prior written permission of Fusion Media and/or the data provider. All intellectual property rights are reserved by the providers and/or the exchange providing the data contained in this website.
Fusion Media may be compensated by the advertisers that appear on the website, based on your interaction with the advertisements or advertisers.
© 2007-2025 - Fusion Media Limited. All Rights Reserved.