There are many “seasonal” tendencies that have played out in the stock market during post-election years and also during years ending in the number '7'.
The months of July and December have typically performed well during post-election years. Beyond that:
a) We are in BOTH a post-election year AND a year ending in '7'.
b) The months of August, September and October have been particularly brutal in the past when this combination occurred.
Does this really matter and/or will it affect the market in 2017? I'm not sure but it may be worth knowing about if defensive action is called for in the months ahead.
The August-September-October (Post-Election/Year '7') Bermuda Triangle
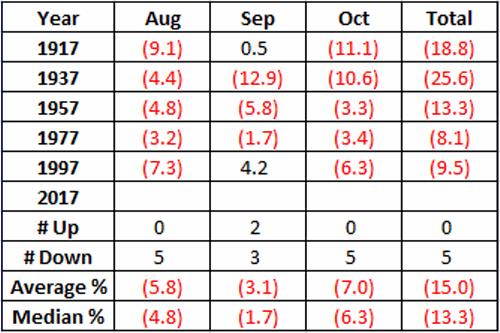
Figure 1 below displays the percentage price change (no dividend data is included, price change only) for the Dow Jones Industrial Average during the aforementioned period.
Figure 1: August/September/October Dow monthly price changes during post-election years ending in '7'
*As you can see, the month of September has showed a gain 2 times, while August and October – and the 3-month period as a whole – are both 0-5 in the past century. So only 2 of the 15 months in total showed a gain.
*The average 3-month performance for the 'post-election/year-7 Bermuda Triangle was -15.0%.
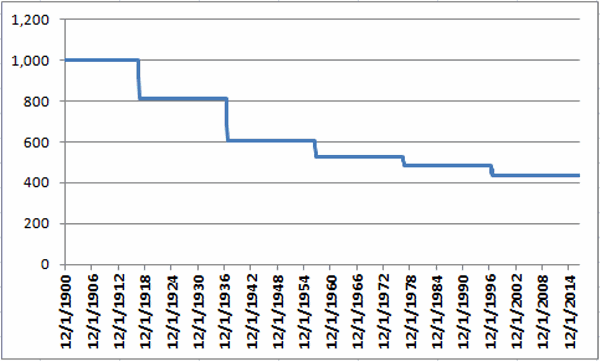
Figure 2 displays a monthly equity curve of just this period. It’s not a pretty picture.
Figure 2: Growth of $1,000 invested in the Dow ONLY during August, September and October of 'post-election years ending in '7'
Summary
Let’s face it, it’s pretty easy to dismiss this data as some anomaly or calendar quirk based on a ridiculously small sample size. And don't assume that I'm predicting anything.
The only thing I do know is that if the market starts to breakdown anytime leading up to or within the August through October period, there will be at least one market blog writer taking some serious defensive action.

