Key Points:
- Price action enters a support zone.
- RSI Oscillator strongly oversold.
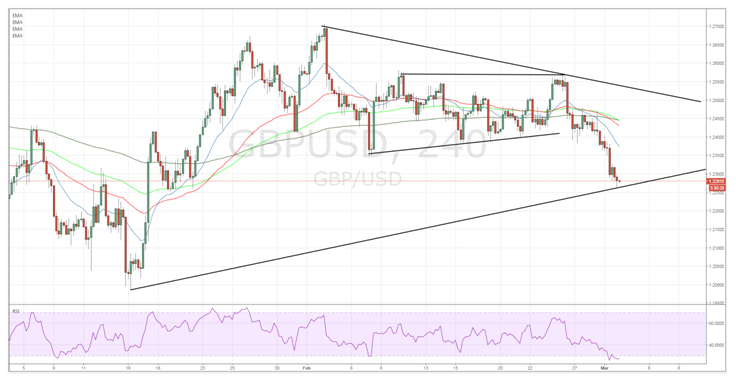
- Short term retracement back towards 1.2346 likely in the coming session.
The Cable has been on a roller coaster over the past few days as price action broke down and dropped through the short term channel formation. However, despite the intraday bias being bearish, the currency is currently reaching the limits of its decline and we are likely to see a rebound in the coming session.
In particular, the defining indicator is the RSI Oscillator which has been trending sharply lower broadly in line with price action’s recent machinations. However, the oscillator has now entered oversold territory and there is subsequently building pressure for some relief. Additionally, price action has also entered a historically important area, from late 2016, which has seen reversals occurring. Subsequently, the 1.2259 support level will be relatively critical in the upcoming session if any retracement is to occur.

However, the medium time frame could be a different story with a key swing point at 1.2346 remaining in-tact largely consigning the pair to further declines. In fact, there really isn’t any sign of any form of medium term bottoming just yet which may suggest a deeper decline in play. Subsequently, sustained trading below the 61.8% Fibonacci retracement level is likely to mean further break downs to come.
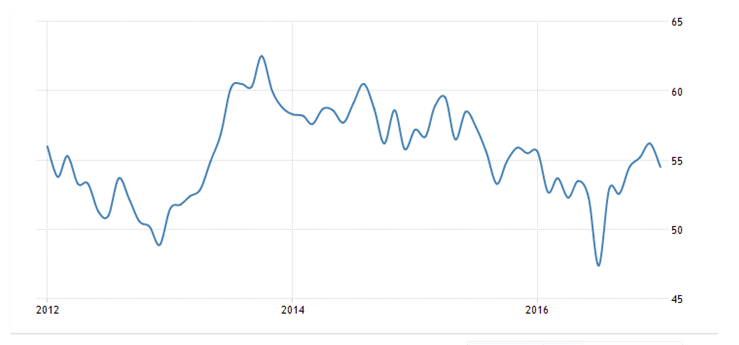
Fundamentally, the Cable has a busy few days ahead with the UK Construction and Services PMI figures due out. In particular, Friday’s Services PMI is likely to be closely watched by the market and will need to exceed the forecast of 54.1 to reverse its current trajectory.

Regardless of the medium term view, the extent of the short term decline has likely run its course especially given the currently oversold RSI Oscillator. In addition, there are plenty of reasons to see a retracement given that price action has also just entered a historic reversal and liquidity zone. Subsequently, the most likely scenario is where the Cable rises back to challenge the support/resistance zone around 1.2346, and possibly back inside the intraday equidistant channel that had formed between 1.2400 and 1.2500. However, keep a close watch on any penetrative moves below the 1.2259 support area as this could be signalling further declines ahead.
