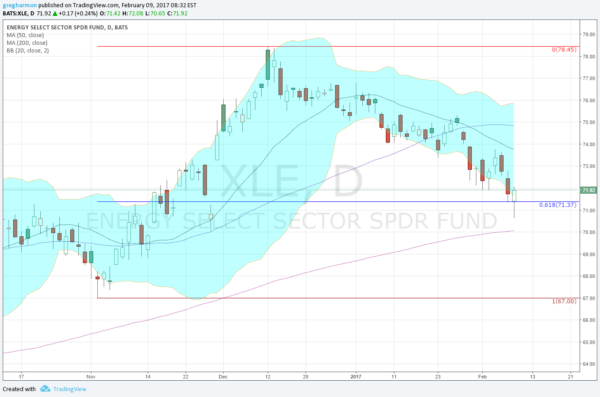
Oil has been a mess the past week. Large oil stocks are flailing. Beyond that, many segments of the energy sector have fallen 10% or more over the last 2 months. It's getting ugly. But when I look at the chart of the Energy Sector ETF (NYSE:XLE), things look much less troubling. In fact, this may be the time to buy.
How many times have you decided to buy a stock, waiting for a pullback to get it cheaper, only to watch it continue to rise? If only it would hit a speed bump and pullback just a little. And when it does, you get anxious about the drop and worry it could keep going lower. So you don’t buy. It reverses and you're back to wishing for a pullback.

The chart above XLE chart above is in one of those situations. It started higher in the beginning of November, reaching a peak in mid December. It gave one opportunity to buy a pullback along the way, but for the most part trended higher the entire time. Since then, it has had a steady decline. Now it's down nearly 9%. Are you ready to buy?
Perhaps. The chart printed a Hammer Candlestick on Wednesday. The Hammer, with the long lower Shadow, is a potential reversal candle. A reversal would confirm on a higher close Thursday. That's what to watch for. The bottom of the Hammer can then be used as a stop-loss level. This Hammer is happening at the 61.8% retracement of the last move higher. This key Fibonacci ratio is a focus point for a reversal for traders. A reversal here would gather attention -- and money.
Just before the U.S. open, XLE was moving higher, but it's the closing price that counts. Keep your energy focused here.
