In the wake of the Fed decision to begin reducing its balance sheet, speculation abounds. Pundits of all stripes are speculating about what this will do to interest rates, the economy, and the stock market.
The answer is easy. Nothing.
Those commenting often make two types of mistakes – omitting important data and using pop economics instead of real analysis. Let’s consider each in turn.
Data
If we put aside the political debate and merely asked about the impact of reduced demand in a market, what would be our approach? We would take the rate of the change and compare it to the daily volume. If it was very small, we would expect little effect. In a Federal court where I was an expert witness the Fidelity Investments team opined that 1% would be small. While no one really knows, that seems reasonable. Let’s do the math.
The Fed plans to halt replacement of maturing Treasury securities at some point in 2018. We do not know the exact plan, so I’ll make a more aggressive assumption. Suppose that the Fed begins immediately—no replacement of maturing securities. Let’s do the math.
- Amount of Treasury holdings expiring in the next five years: $1.4 trillion.
- Dividing by five years: $280 billion per year.
- Dividing by 250 (or so): $1.12 billion per day.
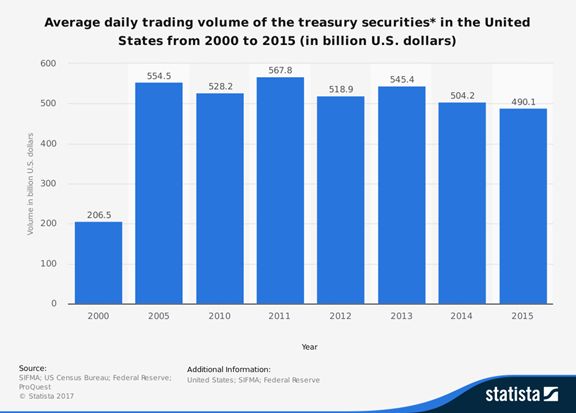
- Total daily volume in the cash Treasury market: $500 billion or so, or about 0.2%.

And this does not count trading in futures markets, where a buyer can hold until delivery if desired.
This is a very deep and liquid market. The error made by many is to compare the size of the Fed balance sheet with net new issuance by the Treasury. Why is this comparison relevant?
Analysis
The net new issuance comparison makes a common, pop econ mistake. It treats a large and complex market as if it consisted of two parties. This may be easier to understand, but so was the concept of “flat earth.” It leads people, like a top TV bond commentator, to ask, “If the Fed and other central banks quit buying new bonds, who will step in?”
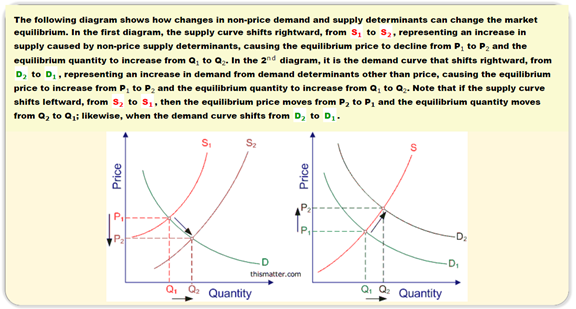
In the last few years we have also witnessed assorted experts asking, “who will buy our bonds?” And then shortly thereafter, shamelessly discussing a shortage of long-term bonds. These are great stories to attract viewers and readers, but a simplistic view of the market. It ignores the millions of participants making up the deep market. This cannot be represented as two parties. A beginning economics class is all you really need. Think about supply and demand in terms of distributions of many players. Consider these simple graphs from a helpful source.

If you look at the chart on the right, you might view the Fed absence from the market as an external shift in demand. This does not affect the plans of other participants, but it does mean less demand at each price, so a shift from D2 to D1. We should expect a lower quantity and price (higher yield), but not a hugely dysfunctional market. During the QE period, I sought estimates from many macro economists about the total effect of QE. Some Fed economists also made a similar estimate – about 1% in the ten-year note.
Over a period of several years, we might expect a gradual adjustment in the ten-year note by 1% — or perhaps less, since some of the balance sheet will be maintained. It is small enough that other factors will be the main drivers.
Conclusions
We can now see why past scary predictions did not come to pass. If every TV pundit was required to pass a two-part test:
- State the size of the bond market;
- Draw and explain one of the charts above…..
…CNBC would have a lot of air time to fill!
