While the majority of the precious metals continue to remain in intermediate uptrends on their weekly charts, platinum continues to try to find its footing after a monthly breakout in August. The metal was briefly up 25% off of its May lows and neck and neck with gold’s return but has since given up more than half of this gain. This 12% correction may have scared off many speculators who tried to buy the Platinum ETF’s breakout through $87.00, but zero technical damage has occurred on this pullback. Instead, we’ve seen a violent shakeout back into the metal’s prior 1-year base, that has held above its key monthly moving average. I believe this is a buying opportunity for investors looking to add platinum to their portfolio, as long as the $80.00 level is defended.

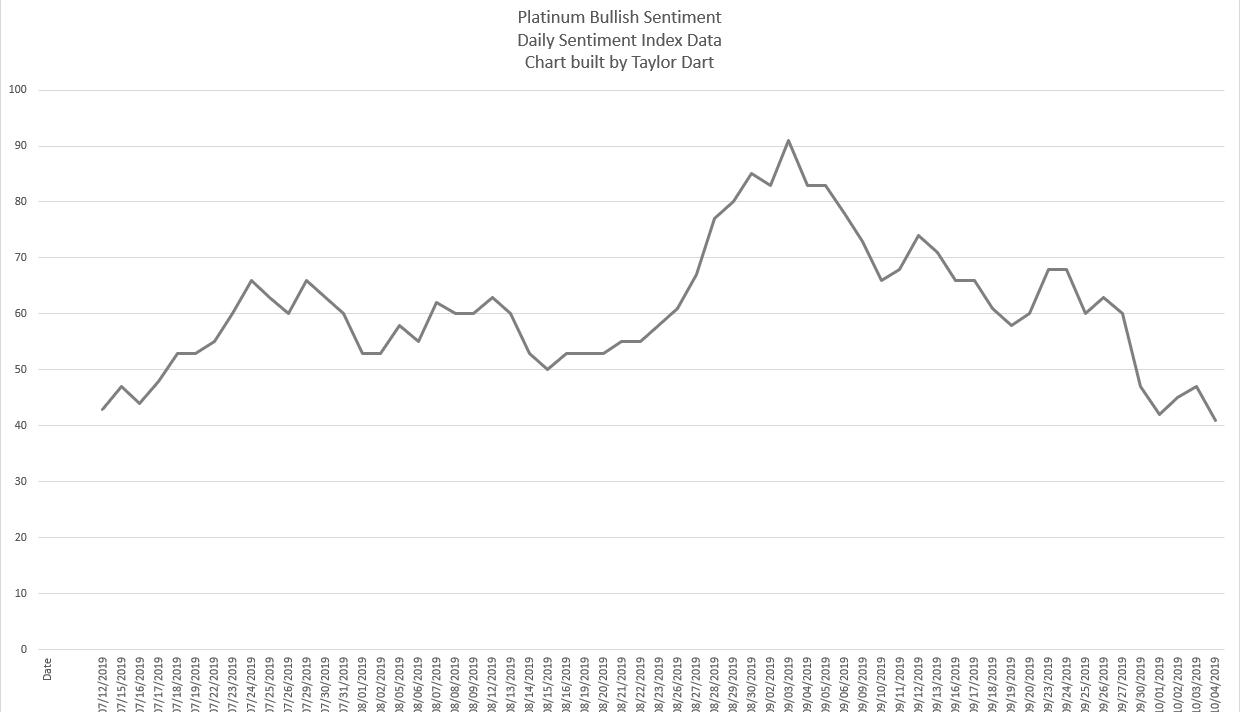
Taking a look at the above chart of platinum sentiment, speculators have likely got chopped to pieces the past month. Everyone got their most bullish at the highs when platinum was up 25% in fifty trading days, and they’re now suddenly pessimistic after the metal has undergone a normal correction. The violent shake-out we’ve seen may seem nasty for those that are long platinum from much higher prices, as they’re now down significantly over the past couple of weeks. Based on this, I believe a good chunk of this correction has been caused by forced selling. This forced selling has come from those that bought at much higher prices, but this selling is irrational.
Why has the selling been irrational? It’s simple. No technical damage has been done.

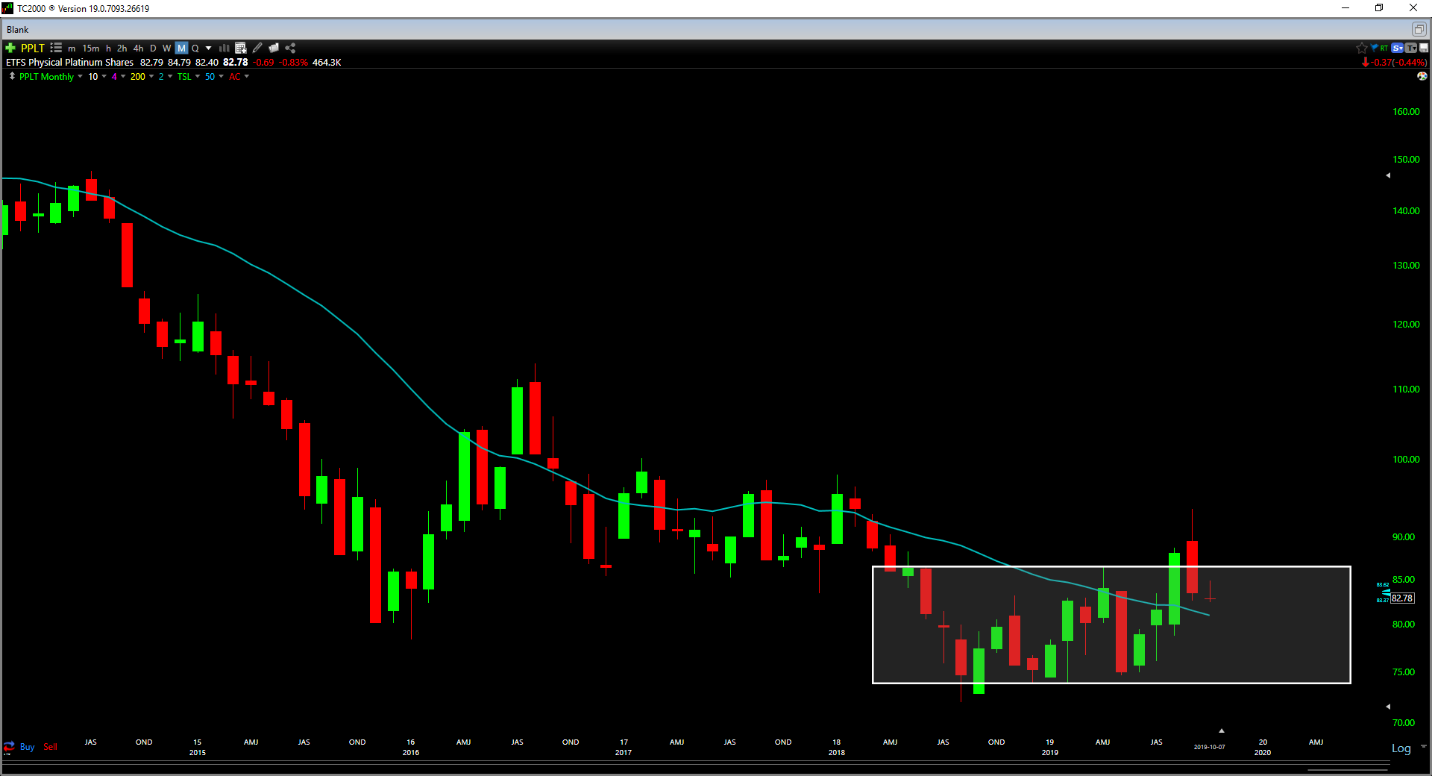
As shown in my platinum article last month, the Platinum ETF broke out of a massive 1-year base in August. It also managed to reclaim its 20-month moving average (teal line). This is generally an intermediate-term buy signal, and any 10% pullbacks after this signal are generally buying opportunities. As we can see, the 20-month moving average’s slope is beginning to flatten out a little, and this correction has seen the metal pull back right to this moving average. While a monthly close below this moving average would be a bearish development, we are still above this level currently. The 20-month moving average currently sits at $80.20, and only a monthly close below $80.00 would be a bearish signal. For this reason, entries under $83.00 on the Platinum ETF are providing a low-risk entry with a very tight 4-5% exit plan if the trade does sour.

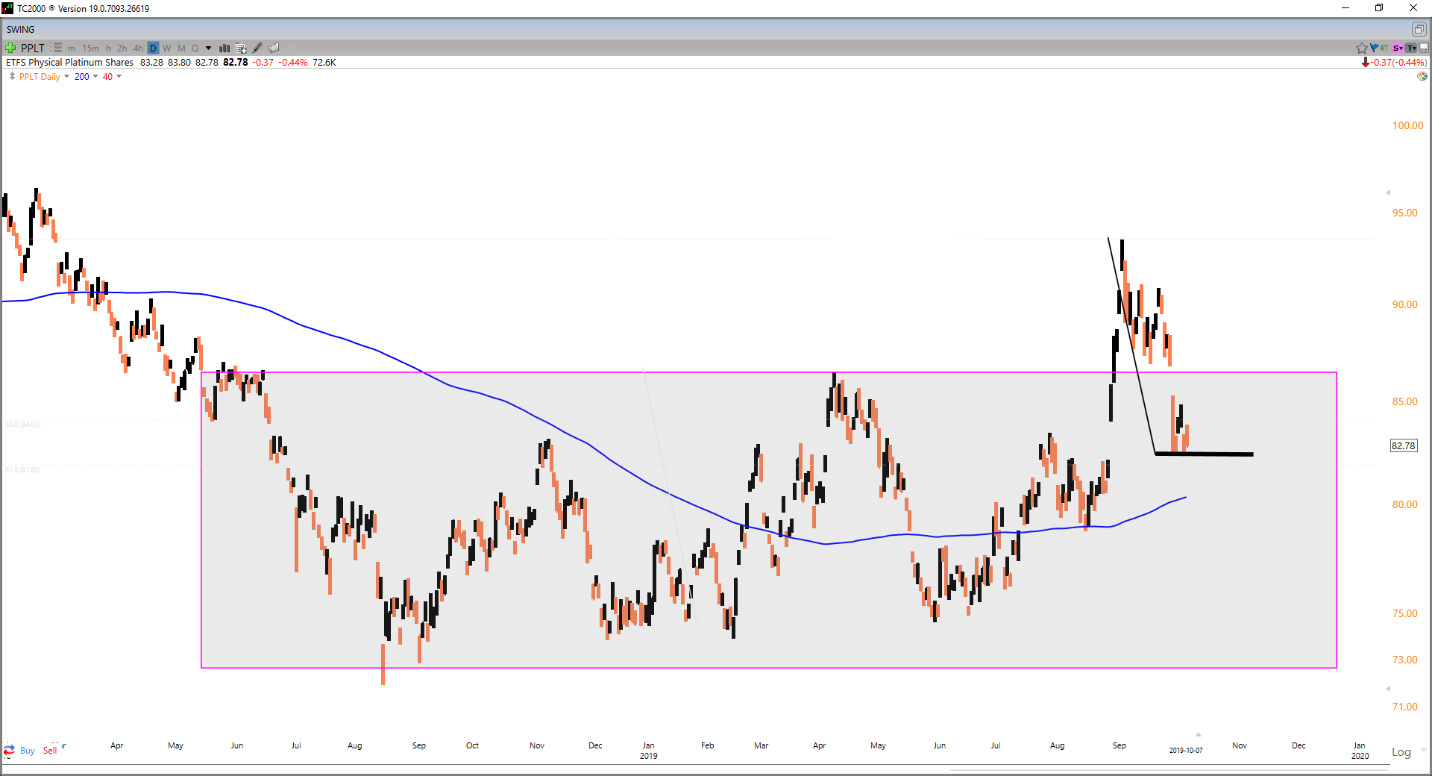
Moving to the daily chart above, we can get a better view of what I’m talking about above. The metal broke out of a 1-year base in late August, retreated inside this base in October, and is now trying to build out a cup base in the upper third of the prior base. I would expect any further weakness to be bought up, with the 200-day moving average sitting just below the $80.00 level also.
The Platinum ETF has pulled back 12% from its highs over the past month, but very minimal technical damage has been inflicted on the ETF. The Platinum ETF is still potentially making a higher low vs. August and remains above its key moving averages. I would view any drops underneath the $83.00 level as buying opportunities, as long as stops are used. Bullish sentiment has plummeted from 92% bulls to 40% bulls, and most are looking lower at precisely the wrong time. Rather than run with the herd, I believe this is an opportune time to take advantage of this weakness.
The Aberdeen Standard Physical Platinum Shares ETF (NYSE:PPLT) was trading at $83.74 per share on Tuesday morning, up $0.96 (+1.16%). Year-to-date, PPLT has declined -5.35%, versus a 8.95% rise in the benchmark S&P 500 index during the same period.
PPLT currently has an ETF Daily News SMART Grade of C (Neutral), and is ranked #12 of 33 ETFs in the Precious Metals ETFs category.
(Disclosure: The author owns shares of Platinum ETF (PPLT)
