Certain precious metals, gold, silver, and platinum have shown moderate upside price trending over the past 20+ months while rhodium and palladium have skyrocketed higher. These more precious metals, Rhodium and Palladium, have many industrial and consumer uses. Rhodium is used in electronics and plating and Palladium is used in a variety of consumer products from Automobiles to Medical Devices.
Still, the rally in Rhodium (over 300%) and Palladium (over 70%) over the past 12 months has been more than impressive. Whey are we not seeing a similar rally in Gold, Silver, and Platinum yet?
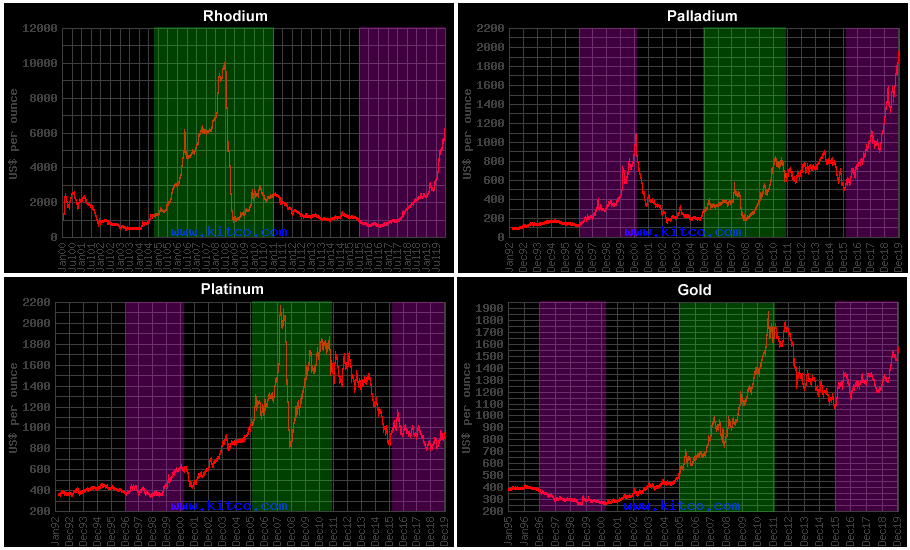
The reality is that we are seeing a similar price rally in Rhodium and Platinum as we saw in 2004~2008 – just prior to the Global Credit Crisis. Take a look at the composite chart below.
There are few interesting components of these charts that show how precious metals reacted throughout the 1997~2000 rally and the 2005~2008 rally – both of these events set up a bubble burst reversion
event.
_ Rhodium rallied extensively in 2005 through 2008 – peaking at levels near $10,000 just before the credit crisis bubble burst.
_ Palladium rallied a moderate amount in 2005 through 2007, then sold off as the bubble burst. Then rallied to over $800 after fear set into the markets.
_ Platinum began a rally in early 2000 that propelled it to a peak in 2007 (just before the peak in the US stock market). Since then wild price rotation and a moderate reversion to levels near $1000 have set up a massive basing pattern.
_ Palladium, being an industrial use metal and being deployed in a variety of advanced technology, would tend to rally as demand for technology products and consumer products associated with Palladium components are in very high demand. Much like what happened in 1998~2000.
_ Rhodium’s rally is very likely related to manufacturing and institutional demand across the globe.
_ Platinum and Gold may be set up for an incredible upside price rally should Rhodium and Palladium extend their rallies even further.
_ We find it incredibly fascinating that Rhodium rallied nearly 1000% from 2004 to 2009 – just before the peak in the global stock markets and the start of the Global Credit Crisis.
_ We also find it incredibly interesting that Palladium rallied over 1000% from 1995 to 1999 – just before the DOT COM bubble burst.
_ We believe the rallies in Rhodium and Palladium are early warning signs that can’t be overlooked by skilled traders/investors.

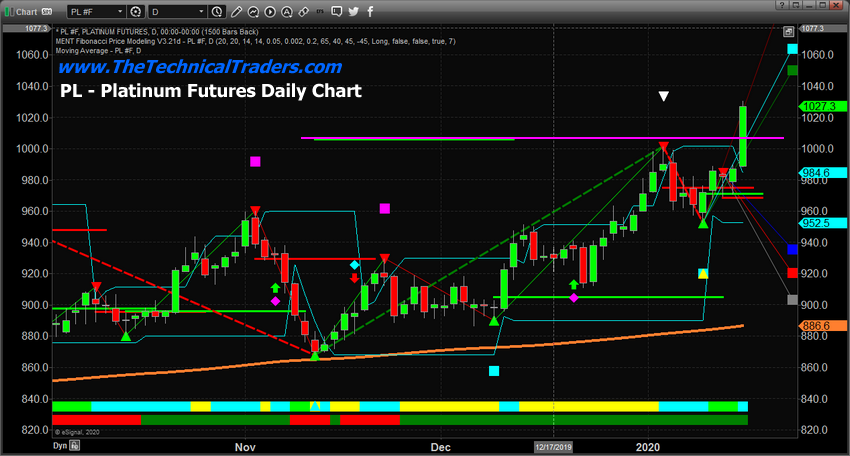
The recent upside breakout of Platinum falls into the same category as the late 1998 Platinum rally as the valuations of the DOT COM rally began to overextend. We believe this shift into high-value risk protection began to take place as investor’s fear levels increased in the late 1990s. As we suggested recently – a shifting of the undercurrents in the markets.
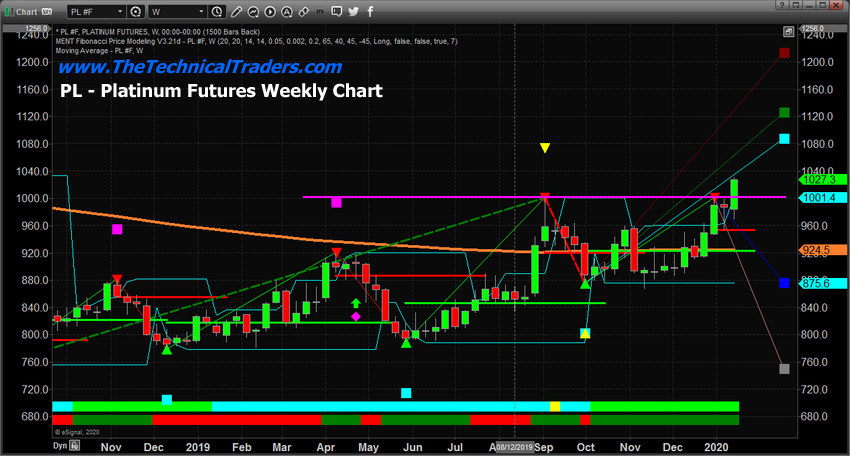
The current rally above $1000 in Platinum suggests a new upside price rally is taking place after an extensive basing pattern (2015 to now). Should Platinum rally above $1200 per ounce, a new technical bullish trend will be confirmed.

Our proprietary Fibonacci price modeling system is suggesting price targets on the Weekly chart of $1090, $1130 and $1215. Pay very close attention to this rally in Platinum as it could become the catalyst for a much bigger move in many of the major precious metals. The Platinum rally in 1997 began an upward price advance of nearly 600% over the next 10 years. A similar move today would put Platinum near $6000~$7000 – Gold would be near $3200+ should this happen.

Our belief is that the rally in Platinum will continue as valuations in the global markets push higher. Fear is creeping back into the markets as investors are expecting some type of price reversion event. We believe the current setup is very similar to a mix of the events we’ve highlighted in the composite metals chart, above. A mix of what happened in 1995~1997 and a mix of what happened in 2005~2007. Platinum and Gold are acting very similar to what happened in 1995~1997. Palladium and Rhodium are a mix of 1995~1997 and 2005~2007. Overall, the rallies in Rhodium and Palladium are strangely similar to “peak everything” bubbles.
