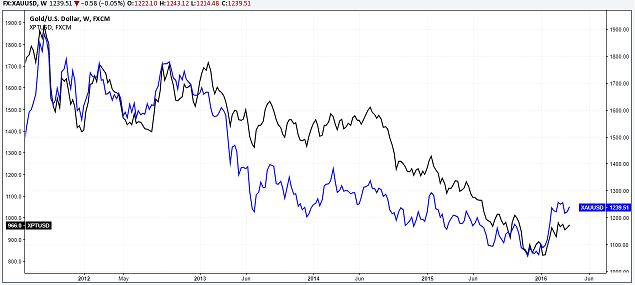
While the markets have been overly focused on the gains in the precious yellow metal, platinum has remained largely in the shadows of the more popular gold. Indeed, compared to gold's impressive rally over the first quarter of this year, platinum has seen a more muted response, gaining a meager 9.0% compared to gold's 16.0% gains in the same period.
Gold was of course in the news and shining for many reasons, from the flight to safety to what could potentially turn out to be the end of the secular bear rally in the commodity markets. But without getting ahead, it's still too early to say whether gold has indeed bottomed out. It wasn't long ago that many big institutional banks were calling for a $1000 price level in gold (akin to EUR/USD parity, if one can recollect). The first quarter's market turmoil, which sent investors to seek safe haven assets, has indeed proven to be a big boon for the metals group.
While gold garners a lot of attention, it does come with the risk that the rally is starting to show signs of being overstretched. While gold has managed to make daily gains of over 1.0% in the past weeks, it is very likely that we will be seeing some pullback to the rapid momentum-led gains which might have left many traders on the sidelines.
Similar to gold, platinum comes in the same playing field. Both are precious metals and platinum, just like gold, finds its uses varying from autocatalysts to jewelry.
The chart below shows the comparison between gold and platinum, and it is not hard to miss how these two metals have been trading in almost the same trends.

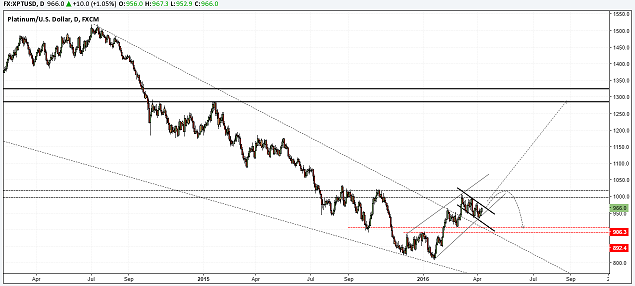
From a technical point of view, the daily chart in platinum shows a rather interesting set up. Platinum managed to break out from a long-term falling trend line, part of the descending wedge pattern, and also broke above the horizontal resistance near 906 – 892 level. While prices pulled back after the breakout, there has been no retest to this support level. While the bias for platinum is expected to show a pullback ahead of a larger rally, the view is contradictory, based on the bullish flag pattern that is currently forming. A break higher above the previous pivot high near 1017 – 994 could potentially see platinum move strongly higher (or even set up a classic bull trap).

To the upside, if the immediate resistance at 1017 – 994 is broken, platinum could see a strong rally which could eventually see prices retest the higher resistance level near 1300 – 1325. While to the downside, the fakeout on the bullish flag pattern could see prices fall back to retest the broken support near 906 – 892 levels to establish support. Of course, this alternate view could be at risk if platinum does indeed manage to break the near-term resistance.
Between gold and platinum, it is very likely that gold prices could take a backseat against platinum’s impending rally (subject to the break of the resistance at 1017 – 994).
Following a soft start this year, manufacturing has shown signs of turning the corner across the board, from China to the US. If the pace of trend remains, it could be likely that higher demand for platinum could start to see the effects rub into the price as well.
