
Premium consumer goods company Pilgrim's Pride Corporation (NASDAQ:PPC) reported better-than-expected results for fourth-quarter 2017.
Earnings
The company’s quarterly earnings of 54 cents per share surpassed the Zacks Consensus Estimate by a penny. Also, the bottom line comfortably exceeded the year-ago tally of 28 cents per share.
Adjusted earnings for 2017 came in at $2.79 per share, missing the Zacks Consensus Estimate of $2.82. However, the bottom line came in higher than $1.73 recorded in the prior-year period.
Revenues
In the reported quarter, Pilgrim's Pride generated net revenues of $2,742.4 million, up 15.7% year over year. In addition, the top line comfortably surpassed the Zacks Consensus Estimate of $2,557 million.
Revenues from U.S. operations came in at $1,886.1 million, up 18% year over year. Mexican operations generated revenues of $333.8 million in the reported quarter, up 8% year over year. Top-line results from the company’s European operations also improved 12.9% year over year to $522.5 million.
Aggregate revenues in 2017 came in at $10.77 billion, up 9% year over year. The top line also outpaced the Zacks Consensus Estimate of $9.45 billion.
Pilgrim's Pride Corporation Price, Consensus and EPS Surprise
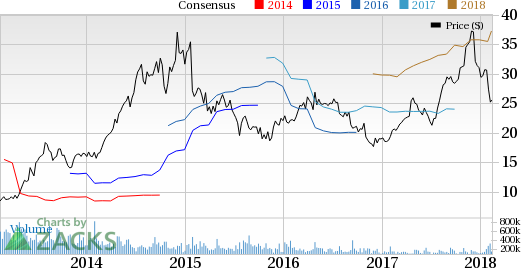
Pilgrim's Pride Corporation Price, Consensus and EPS Surprise | Pilgrim's Pride Corporation Quote
Costs/Margins
Pilgrim's Pride's cost of sales in the reported quarter increased 15.8% year over year to $2,480.5 million. Gross margin contracted 20 basis points (bps) year over year to 9.5%.
Selling, general and administrative expenses flared up 30.2% year over year to $105.5 million. Adjusted earnings before interest, taxes, depreciation and amortization (EBITDA) margin came in at 8.8%, expanding 10 bps year over year.
Gross margin for 2017 was 13.7%, up 250 bps year over year. Adjusted EBITDA margin in the year came in at 12.9%, advancing 250 basis points year over year.
Balance Sheet/Cash Flow
Pilgrim's Pride exited the fourth quarter with cash and cash equivalents of approximately $581.5 million, up from $292.5 million recorded on Dec 25, 2016. Long-term debt (net of current portion) was $2,635.6 million, as against $1,396.1 million as of Dec 25, 2016.
In the reported quarter, the company generated $801.3 million of cash from its operating activities, up 0.7% year over year. Capital spending totaled $339.9 million compared to $341 million incurred in the year-ago quarter.
Outlook
Pilgrim's Pride noted that the Moy Park acquisition (September 2017) will make it a globally popular chicken and chicken-based Prepared Foods producer over the long term. Moreover, the successful integration of GNP Company (January 2017) will bolster the company’s revenues and profitability in the quarters ahead. Also, completion of the $141-million investment program is anticipated to boost the company’s competency.
Zacks Rank and Stocks to Consider
Pilgrim's Pride carries a Zacks Rank #4 (Sell). Some better-ranked stocks in the Zacks Categorized Consumer Staples Sectorare listed below:
Craft Brew Alliance, Inc. (NASDAQ:BREW) carries a Zacks Rank #2 (Buy). The company has pulled off an impressive average positive earnings surprise of 250.20% over the last four quarters.
Blue Buffalo Pet Products, Inc. (NASDAQ:BUFF) also holds a Zacks Rank #2. The company generated an average positive earnings surprise of 3.14% in the preceding four quarters.
Church & Dwight Company, Inc. (NYSE:CHD) carries a Zacks Rank #2. The company recorded an average positive earnings surprise of 6.61% during the same time frame.
The Hottest Tech Mega-Trend of All
Last year, it generated $8 billion in global revenues. By 2020, it's predicted to blast through the roof to $47 billion. Famed investor Mark Cuban says it will produce ""the world's first trillionaires,"" but that should still leave plenty of money for regular investors who make the right trades early.
See Zacks' 3 Best Stocks to Play This Trend >>
Blue Buffalo Pet Products, Inc. (BUFF): Free Stock Analysis Report
Craft Brew Alliance, Inc. (BREW): Free Stock Analysis Report
Pilgrim's Pride Corporation (PPC): Free Stock Analysis Report
Church & Dwight Company, Inc. (CHD): Free Stock Analysis Report
Original post
Zacks Investment Research